
Figure 6.
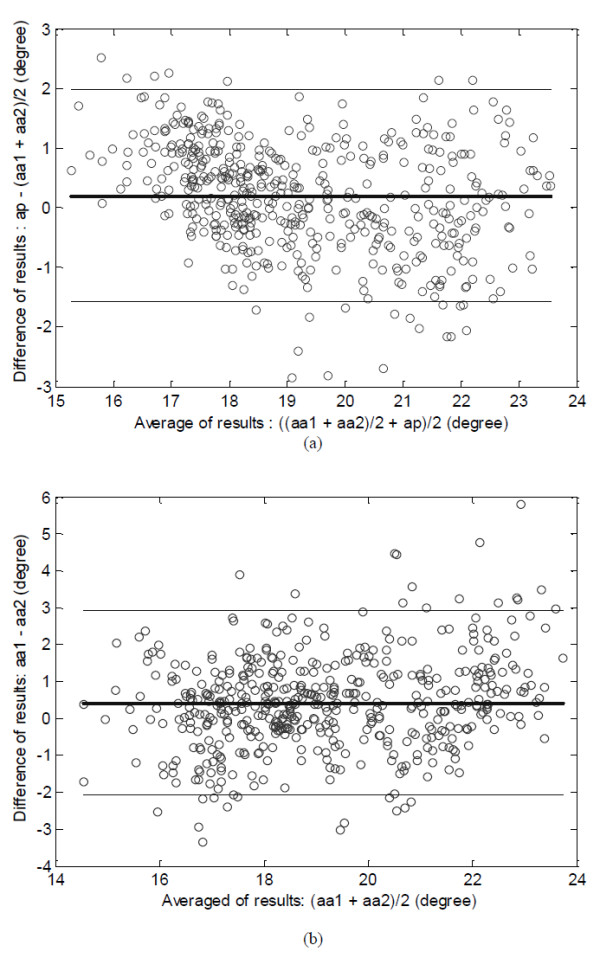
The Bland-Altman plot. (a) The Bland-Altman plot of the mean fascicle orientations estimated manually by the two operators, (aa1 + aa2)/2, and the results obtained using the proposed automatic method, ap. (b) The Bland-Altman plot of the results obtained by the two operators. The bold horizontal line represents the mean and the thin lines indicates the mean + 1.96*SD and mean-1.96*SD levels. SD represents standard deviation.