
Figure 3.
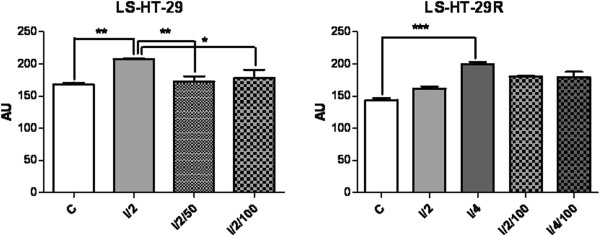
Representation of lesion scores (LS) of the HT-29 and HT-29R CC cell lines. Controls (C); irradiated with doses of 2Gy (I/2) and 4Gy (I/4) of gamma irradiations; exposed to 50 μg/ml or 100 μg/ml L-OHP and irradiated with a dose of 2Gy radiations (I/2/50 and I/2/100, respectively); exposed to 100 μg/ml L-OHP and irradiated with doses of 2Gy (I/2/100) and 4Gy (I/4/100); values are means of three experiments (* p < 0.05, ** p < 0.001 and *** p < 0.0001, one-way analysis of variance test).