
Figure 4.
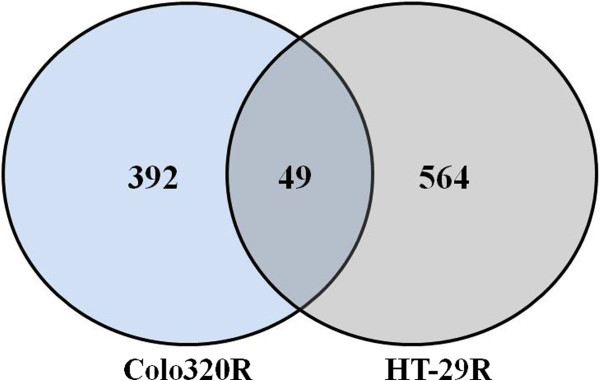
Venn diagram of DE genes induced by L-OHP in tested cell lines. The overlap area indicates the common set of genes (sequences) modulated by L-OHP in Colo320R and HT-29R cell lines. In the left area is represented the number of the genes (392) modulated by L-OHP only in Colo320R, whereas in the right area is represented the number of the genes (564) uniquely modulated by the drug in HT-29R cell line.