
Figure 6.
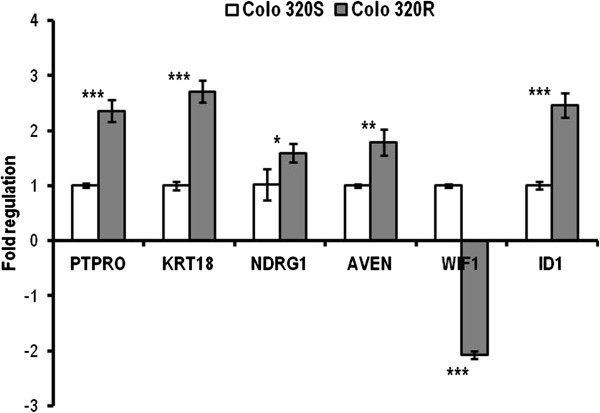
qRT-PCR validation of microarray results in Colo320 cell line. The bars represent the mean (± SD) of three biological replicates for every gene. All genes were normalized to 18 rRNA and fold regulation was calculated relative to Colo320S. (* p < 0.05, ** p < 0.01, *** p < 0.001).