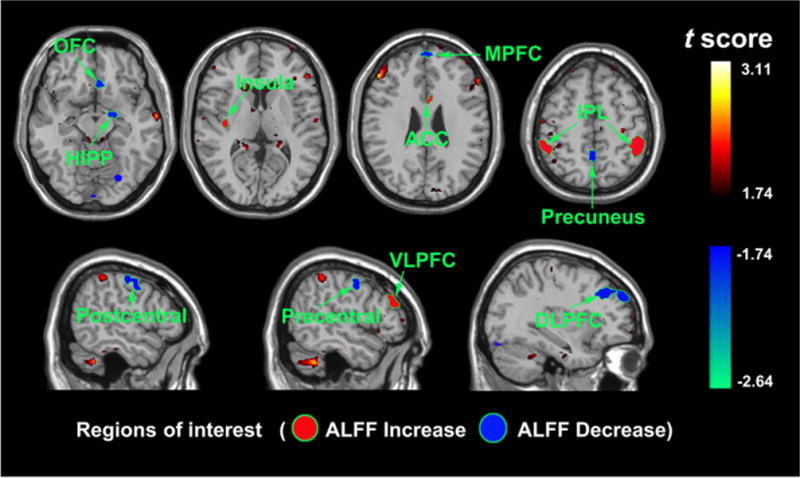
Figure 1.

Functional mapping of the brain areas showing significant amplitude of low-frequency fluctuation (ALFF) alterations between the Prader–Willi syndrome (PWS) and control groups during the resting state. ACC, anterior cingulate cortex; DLPFC, dorsolateral prefrontal cortex; HIPP, hippocampus; IPL, inferior parietal lobe; MPFC, medial prefrontal cortex; OFC, orbitofrontal cortex; VLPFC, ventrolateral prefrontal cortex.
