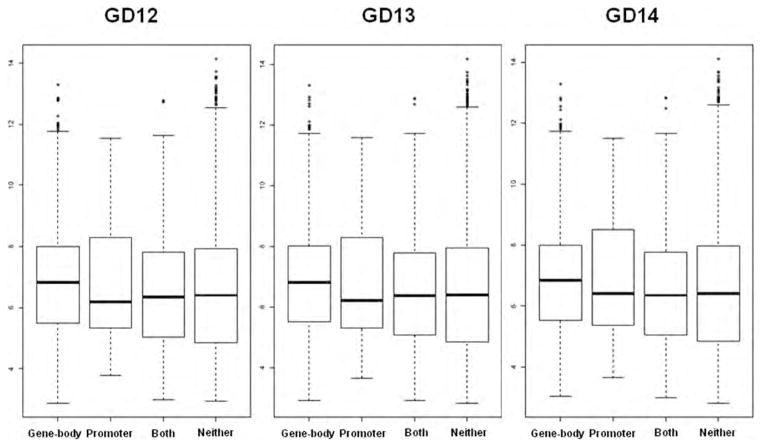
Figure 5.
Expression of gene-body versus promoter methylated genes. Boxplots of log2 expression levels for gene-body only methylated genes, promoter only methylated genes, genes that have both gene-body and promoter methylation and nonmethylated genes on all three gestational days. Data were obtained from previously published Affymetrix Murine Genome U74Av2 GeneChip arrays (Mukhopadhyay et al., 2004).

