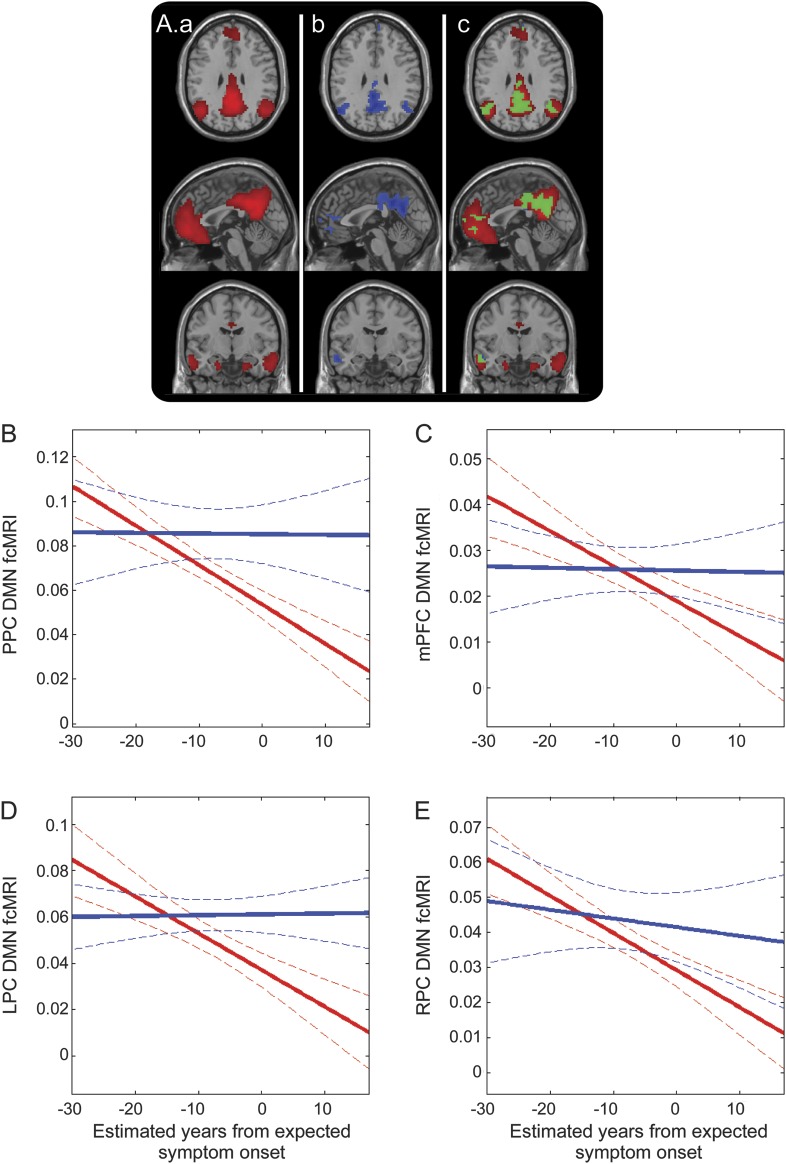
Figure 3. Decreasing DMN connectivity as subjects approach and surpass their expected age of symptom onset.
(A) Illustration of the DMN component (a; red); regions within the DMN that show negative correlation with eYO (p < 0.001; b; blue); overlap between the left and middle panels with common regions in green (c). Decreased connectivity within the DMN as measured in a 10-mm sphere based in the PPC (B), mPFC (C), LPC (D), and RPC (E). Solid lines denote linear correlation (with M− in blue and M+ in red) and curved dotted boundaries represent 95% confidence intervals. DMN = default mode network; eYO = estimated years from expected symptom onset; fcMRI = functional connectivity MRI; LPC = left lateral parietal cortex; mPFC = medial prefrontal cortex; PPC = precuneus/posterior cingulate; RPC = right lateral parietal cortex.

