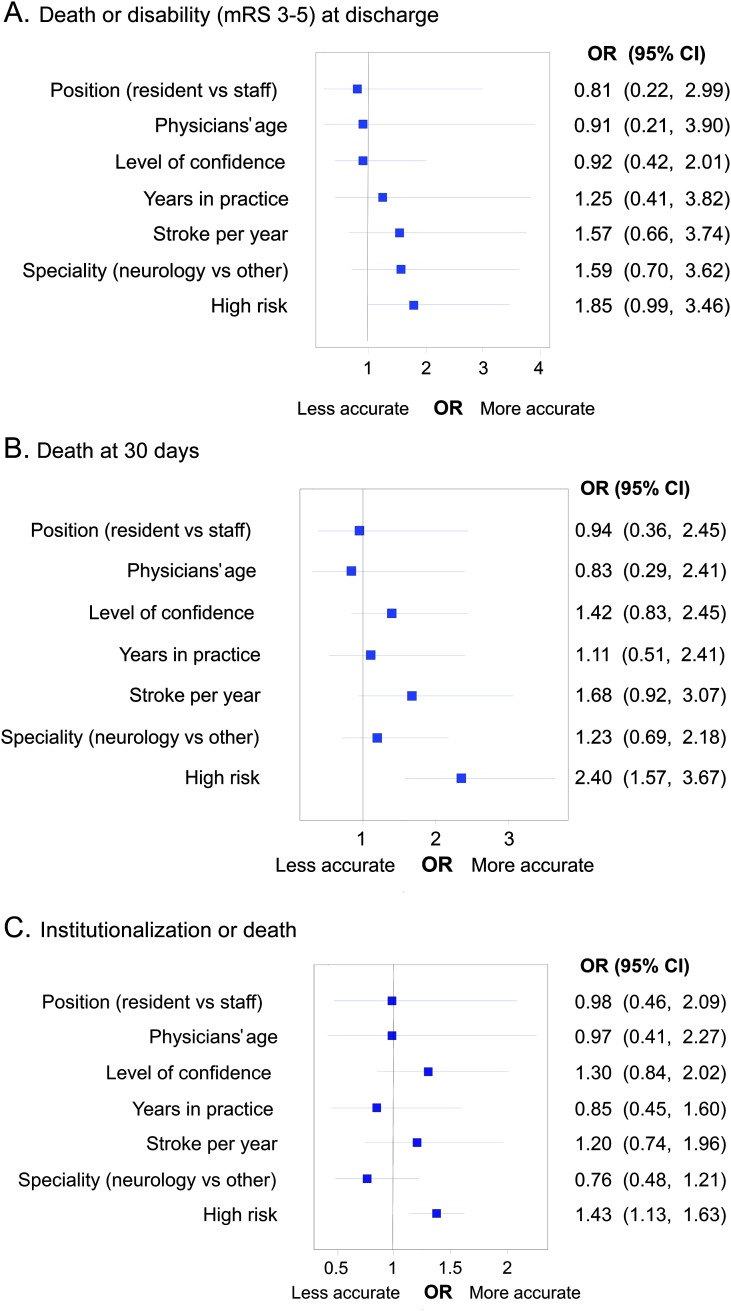
Figure 2. Forest plot representing variables associated with clinicians' accuracy.
Forest plot representing variables associated with clinicians' accuracy for outcomes of interest. (A) Death or disability (modified Rankin Scale [mRS] 3–5) at discharge. (B) Death at 30 days. (C) Institutionalization or death. Note that high risk cases were associated with clinicians' outcome predictions. Further details are explained in the text. CI = confidence interval; OR = odds ratio.

