
Figure 2.
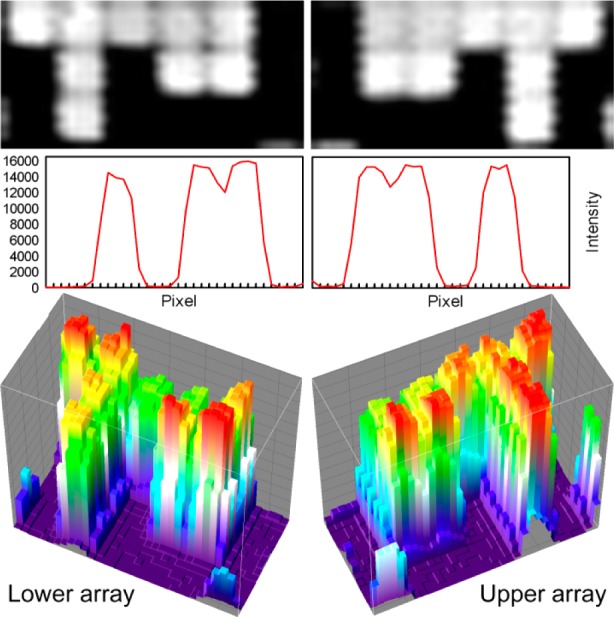
Scanned images and pixel intensities from two mirror-image microarrays synthesized simultaneously. Figures on the left are from the lower substrate (closest to quartz block in Figure 1), and those on the right are from the upper substrate. Top row: 3 × 6 array of features from the center of a 1024 × 768 array, scanned at 2.5 μm. Each features measures 13 μm × 13 μm and are separated by a 0.7 μm gap. Middle row: Intensity profiles of lines drawn horizontally through the close-ups above. Lower row: 3D surface intensity plots of the same close-ups.