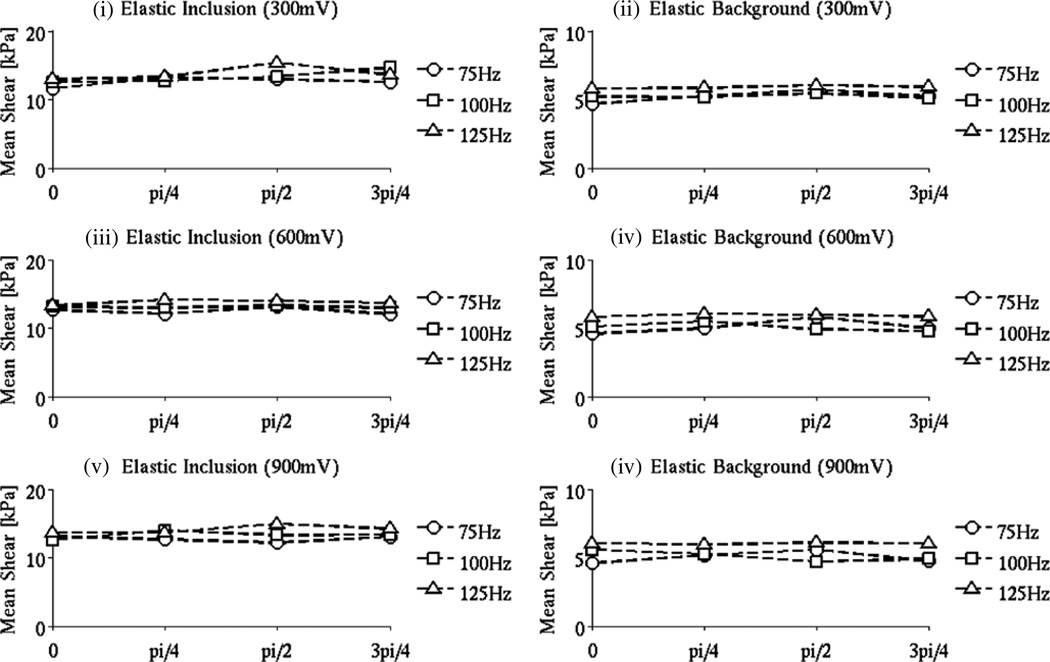
Figure 4.
LEI mean shear modulus values for the background and inclusion (the domains were segmented based on the MR magnitude images) in the baseline phantom as a function of the motion magnitude when a uniform phase shift (0, π/4, π/2, 3π/4) was added. The excitation frequencies considered were 75, 100 and 125 Hz, and the driving signal amplitudes were 300, 600 and 900 mV, respectively.

