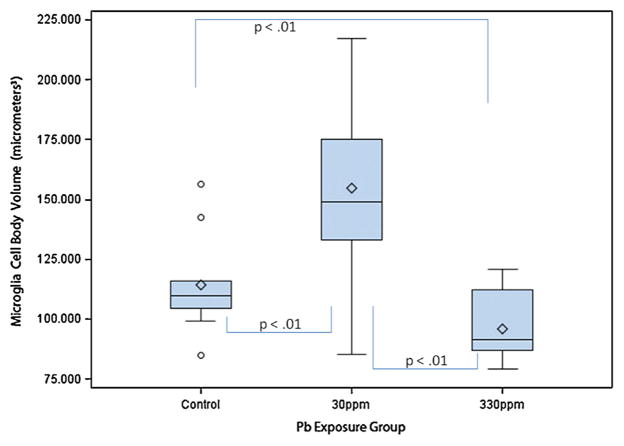
Fig. 1.
Microglia mean cell body volume in μm3 by exposure group in dentate gyrus. The box plots show the distributions of microglia mean cell body volumes in young C57BL/6J mice exposed to 0 ppm (n = 10), 30 ppm (n = 10), or 330 ppm (n = 10) Pb acetate from birth to PND 28 (N = 30). Box plots show the inter-quartile range (25–75th percentile); bars indicate the location of maximum fence values (±1.5x the IQR); central diamond shows the mean; central line shows the median; extreme values are shown with circles. Comparison bars between groups show p values from post hoc tests of marginal (“least square”) means. Group difference confidence limits are provided in the text.

