
Figure 1.
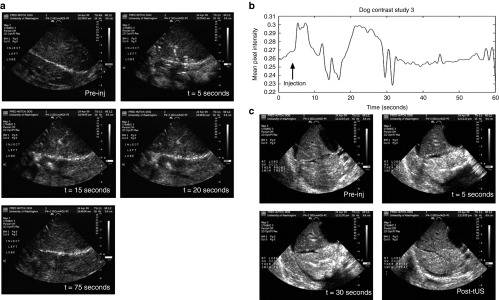
Ultrasound (US) imaging of microbubbles (MBs) injected into dog livers during wash-in and wash-out studies. Images were obtained using an HDI 5000 US imaging system (Philips Healthcare, Bothell, WA) equipped with a contrast-specific imaging package and a P4-2 transducer to illustrate the timing of MB flow dynamics. (a) US B-mode images of the dog liver were obtained before Definity MB injection (given as a 300 μl bolus into the portal vein (PV)), immediately after injection (5 seconds, first peak), 15 seconds post-injection (second peak), 20 seconds post-injection (third peak), and 75 seconds post-injection (return to background level). (b) A quantitative analysis of the persistence of MBs in the dog livers over time (from a) is shown as mean pixel intensity as a function of time. Upon injection of MBs, hyperechoic (or “bright”) regions in the US image appear, and pixel intensities increase for a short time as the MBs are washed away with blood circulation. (c) Images obtained with venous occlusion. A bolus injection of Definity (300 μl) was instilled via segmental PV branch, whereas the IVC was clamped or occluded. Two liver lobes are visible in the diagnostic US images. MBs were trapped in the lower lobe immediately following injection with very few MBs entering the upper lobe, and these MBs persist in the lower lobe for at least 2 minutes. The liver was subsequently exposed to therapeutic US (tUS) for about 1 minute. The US image shows that most MBs are destroyed immediately following tUS exposure. Pre-inj, pre-injection.