Figure 3.

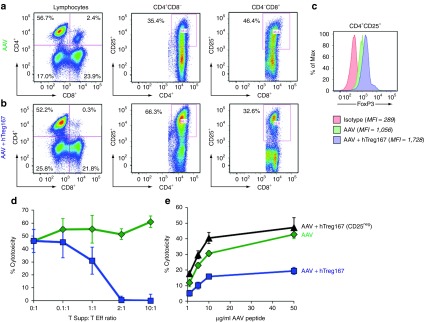
In vitro restimulation of PBMC with Tregitopes results in the expansion of a population of suppressive CD4+CD25+ T cells. Flow cytometry plots of PBMC restimulated in vitro with the AAV MHC I epitope VPQYGYLTL alone (AAV) (a) or with Tregitope 167 (AAV+hTreg167) (b). Cells were gated on lymphocytes after live/dead exclusion, CD3+ T cells, and CD4+CD8- and CD4-CD8+ T cells were analyzed for CD25+. (c) Histogram plot showing FoxP3 expression on CD4+CD25+ T cells restimulated with AAV-only from (a) or AAV+hTreg167 from (b); the isotype control is shown in red. Mean fluorescent intensity (MFI) is indicated in the figure legend. (d) Suppression experiments in which CD4+ T cells (Tsupp) negatively isolated from PBMC restimulated in vitro with AAV+hTreg167 (blue line) or with AAV only (green line) were mixed at defined ratios with CD8+ Teff negatively isolated from PBMC restimulated in vitro with the AAV only. (e) CTL assay in which Teff were derived from PBMC restimulated in vitro with AAV alone (AAV) or with Tregitope 167 (AAV+hTreg167). Alternatively, PBMC were depleted of CD25+ T cells prior to AAV+hTreg167 restimulation (AAV+hTreg167 [CD25neg]). Teff:target ratio 10:1. Results are expressed as % cytotoxicity compared to a max cytotoxicity (cells treated with 10% SDS) after background subtraction. Experiments shown were repeated at least twice. Error bars represent SEM.
