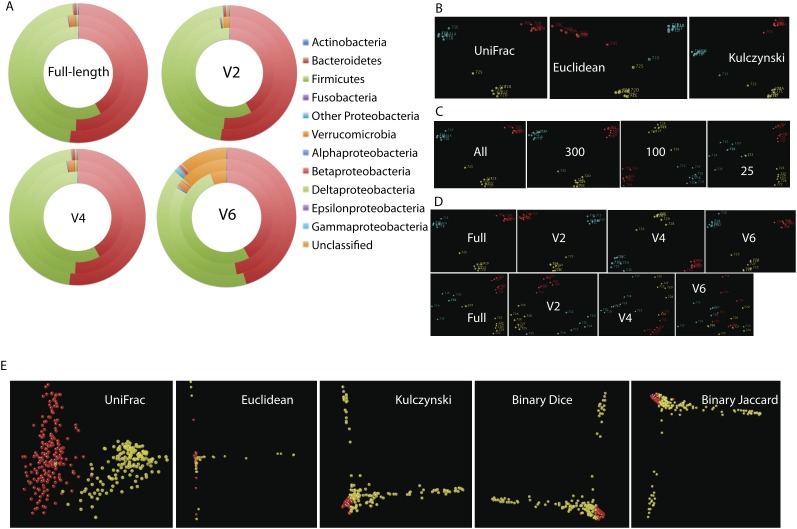
Figure 4.
Comparison of phylogenetic and nonphylogenetic methods for comparing communities. (A–D) Sequences are from stool and six different biopsy sites along the distal gut from three unrelated healthy human subjects (Eckburg et al. 2005); (E) sequences are from 162 free-living communities and 159 vertebrate gut communities (Ley et al. 2008b). Fragments are labeled as either full-length, V2 or V4 (250-nt reads ending at 338R or starting at 515F, respectively), or V6 (80-nt reads ending at 1046R). (A) Effect of fragment on phylogenetic assignment: Each circle is one of the three individual human subjects, pooling sequences from all sites. Note increase in unclassified reads produced by V6; results from V2 and V4 are very similar to those obtained from the full-length sequences. Assignments performed using RDP. (B) Effect of three different distance measures for principal coordinates analysis on the full-length 16S rRNA sequence data: UniFrac (a phylogenetic method), and Euclidean and Kulczynski distances on the sample by OTU matrix (two examples of taxon-based methods). Only the relative positions of and distances between points are relevant: The choice of direction along each axis is a mathematical artifact. Individual points are samples, colored according to the three subjects that the samples came from (i.e., the three colors represent three subjects: The same color scheme is used for panels C and D). In this data set, all methods give broadly equivalent results and cluster the samples by individual, not by sample location (stool or individual sites along the distal gut mucosa). (C) Effect of reducing the number of sequences per sample on the UniFrac clustering, comparing the results obtained using all sequences to results obtained using a random sample of sequences. (Right panel) Clustering is still good, as measured by the consistency of clustering together the samples from the same individual as in panel B, at 25 sequences per sample, although there is more scatter as the number of sequences per sample decreases. (D) Effect of the different regions on clustering with UniFrac using either (top row) all sequences or (bottom row) 25 sequences/sample. For this analysis, we take each full-length sequence, computationally clip out the part of the sequence corresponding to each region to simulate 454 data, and repeat the analysis: The analysis thus includes the effect of the region sequenced, but not the effect of primer bias that may differentially amplify specific taxa. Again, we expect the samples from each individual to cluster together, and a mixture of samples from different individuals indicates poor performance. V6 is especially affected at low sample coverage, and V2 is especially unaffected. (E) Effect of different clustering measures, indicated on each panel, on the data set from Ley et al. (2008a), showing only the (yellow) vertebrate gut and (red) free-living samples. This data set is very heterogeneous and includes many samples with low numbers of sequences per sample or where nonoverlapping regions of the 16S rRNA were chosen for sequencing. In this data set, UniFrac, which is a phylogenetic metric, performs very well, separating the samples into two groups; in contrast, the other three methods, which are all taxon based, perform poorly with obvious clustering artifacts such as spikes leading off at right angles from one another, and fail to separate the two types of samples into two discrete clusters. Note that this figure is not based on the Arb parsimony insertion tree used in Ley et al. (2008a) but rather on a tree constructed de novo from the NAST-aligned sequences using Clearcut (Sheneman et al. 2006). The artifacts in the taxon-based methods are due to lack of overlap at the species level among different kinds of samples. An exploration of primer effects in a subset of these data shows that sample type is more important than region sequenced or length of amplicon (Liu et al. 2007).

