
Figure 1.
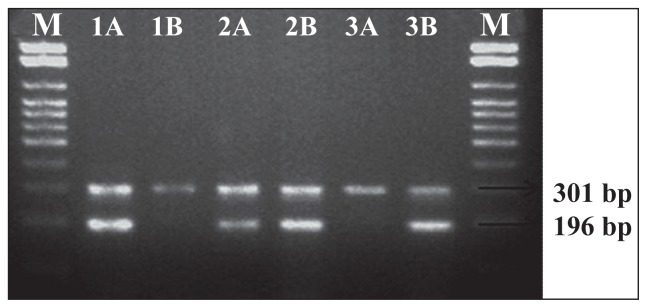
A 2% agarose gel electrophoresis of PCR products of the IL-18 gene at the position −607C>A. The 301 bp bands represent the PCR internal control amplified using the forward control primer and the common reverse primer. The 196 bp bands represents the PCR amplification products of the alleles C and A amplified using the sequence specific primers with the common reverse primers. M: 100 bp DNA marker; lanes 1A and 1B: wild CC genotype; lanes 2A and 2B: CA genotype, and lanes 3A and 3B: AA genotype.