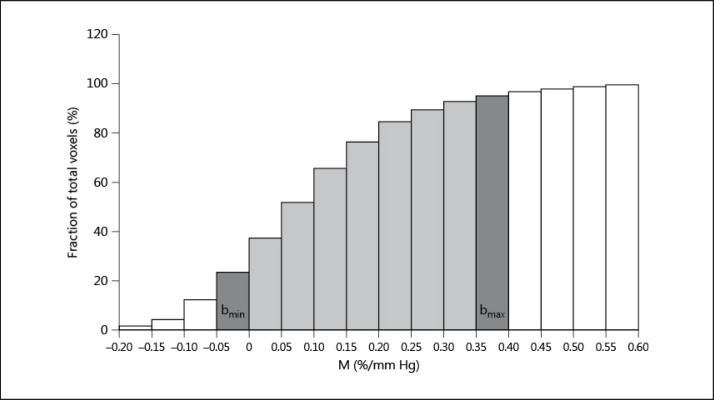
Fig. 2.
Cumulative histogram of reactivity (M) for 1 patient. It is used to define the patient range of reactivity. The highest 5% and the lowest 5% of all M values are excluded from the analysis (white bins). In dark and light grey are all the included bins for this patient. In dark grey are the minimum and maximum reactivity bins (bmin and bmax, respectively).

