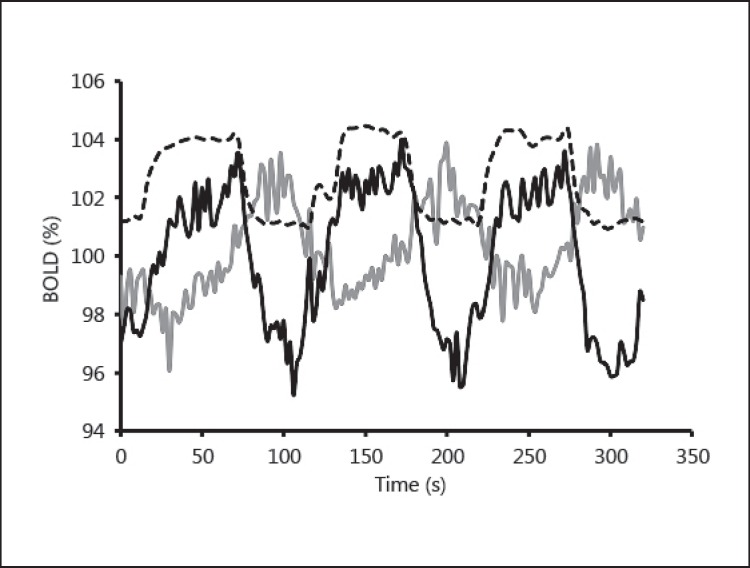
Fig. 4.
The raw BOLD signal for 2 voxels from the same patient is shown. One voxel demonstrates positive reactivity to CO2 (black line) while the other demonstrates negative reactivity (grey line). The PETCO2 (dashed line) varies between approximately 40 and 50 mm Hg. The grey signal shows an initial drop as soon as PCO2 is elevated. However, this is followed by a signal increase during the high PCO2 plateau, which we interpret as a combination of some residual component of true reactivity (vasodilation of vascular beds within this voxel) coupled with steal phenomenon as described in the text.

