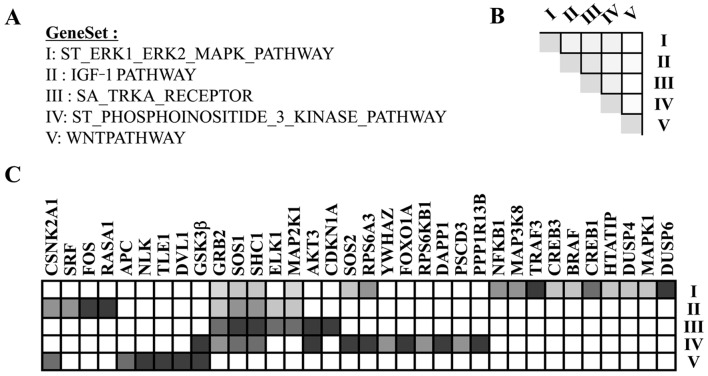
Figure 4.
Leading-edge subset analysis for the mitogenic growth factor gene sets. (A) The list of gene sets used in leading-edge subset analysis. (B) Set-to-set analysis graph shows the overlap between subsets, which is represented by gray color intensity. A dark colored cell indicates that sets A and B have the same leading-edge genes and a white cell indicates that sets A and B have no common leading-edge genes. (C) Heatmap for the clustered genes in the leading-edge subsets. The level of downregulation in very small embryonic-like stem cells (VSELs) is depicted in dark gray color.

