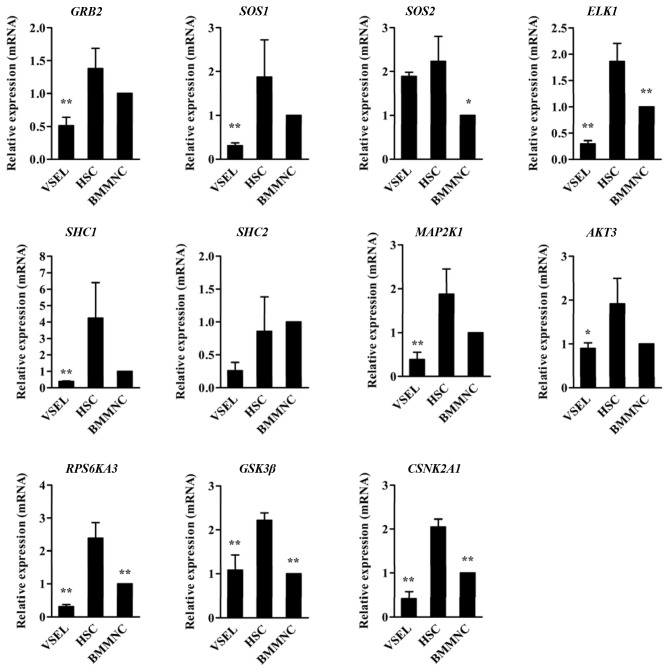
Figure 5.
Expression of growth factor leading-edge genes in murine very small embryonic-like stem cells (VSELs). qRT-PCR analysis of genes specifically downregulated in leading-edge subset analysis (GRB2, SOS1, SOS2, ELK1, SHC1, SHC2, MAP2K1, AKT3, RPS6kA3, GSK3β and CSNK2A1) using the same cDNA library as in the microarray experiments. The expression level is represented as the fold difference relative to the value for bone marrow mononuclear cells (BMMNCs) and is presented as the mean ± SD of at least 3 independent experiments. *P<0.05 and **P<0.01 compared with hematopoietic stem cells (HSCs).

