
Figure 3.
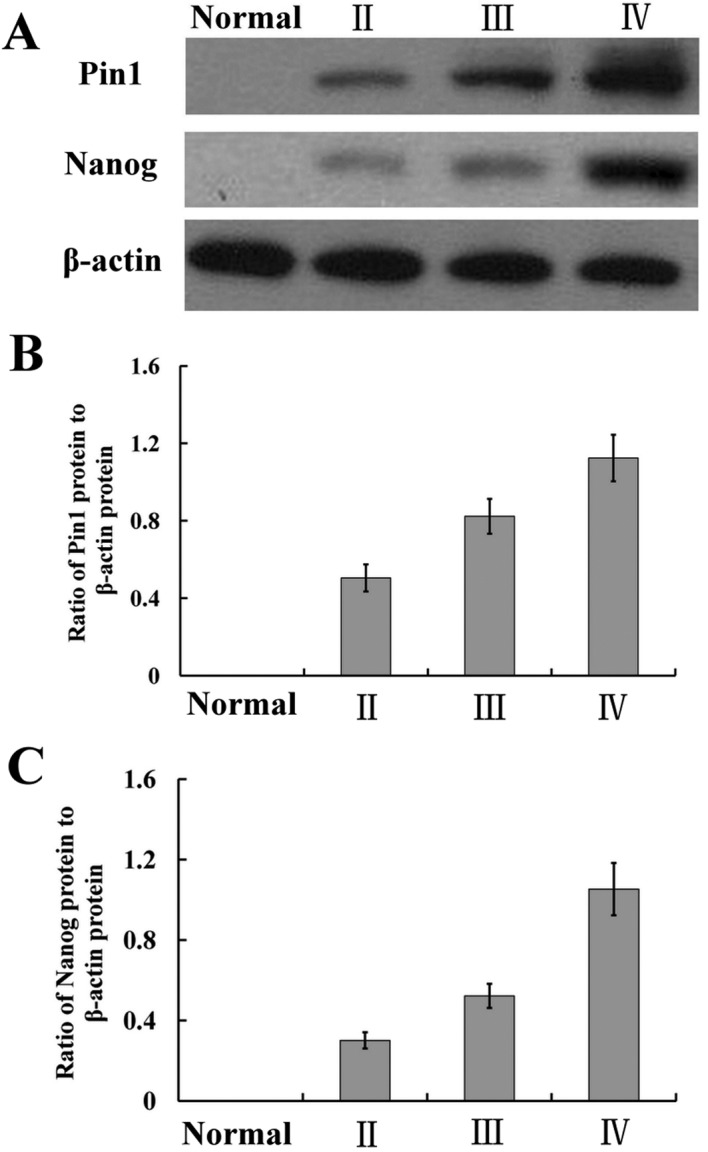
Expression of Pin1 and Nanog protein in differential pathological grade glioma tissues. (A) The expressions of Pin1 and Nanog protein by western blotting in different pathological grade glioma tissues (normal brain tissues as control). (B) Histogram representing the relative level of Pin1 protein as determined by western blot analysis (F=22.962, P<0.01, ANOVA). (C) Histogram representing the relative level of Nanog protein as determined by western blot analysis (F=42.691, P<0.01, ANOVA).