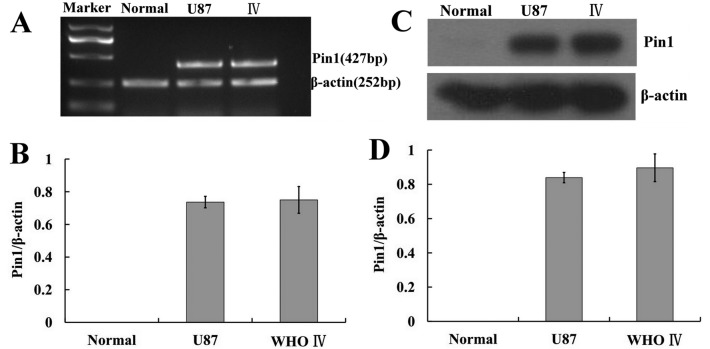
Figure 4.
Expression of Pin1 in U87 glioma cells. (A) Expression of Pin1 mRNA as determined by RT-PCR in U87 glioma cells and WHO IV glioma tissues. (B) Histogram representing the relative level of Pin1 mRNA (P>0.05, independent Student's t-test). (C) Western blot analysis of U87 cells and WHO IV glioma tissues. (D) Histogram representing the relative level of Pin1 protein as determined by western blot analysis (P>0.05, independent Student's t-test).

