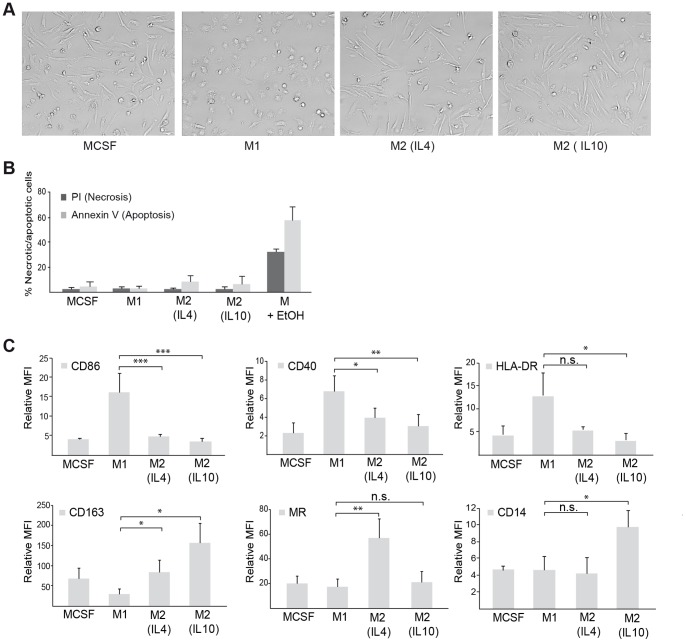
Figure 1. Differentiation of distinct M1 and M2 macrophage populations.
(A) Morphological evaluation of macrophage phenotypes. (B) Apoptosis and necrosis of macrophage populations was evaluated by staining with Annexin V and PI, respectively, followed by flow cytometry. Shown is percent necrotic/apoptotic cells (mean ± SD) from three independent experiments. (C) Expression of extracellular markers for macrophage populations as evaluated by immunostaining and flow cytometry. Relative mean flourescense intensity (MFI) ± SD of three or more independent experiments is shown, where each sample was normalized against its respective isotype control. Relevant statistically significant differences are indicated by * (p<0.05), ** (p<0.01), or *** (p<0.001), non-significant p values are indicated by n.s.

