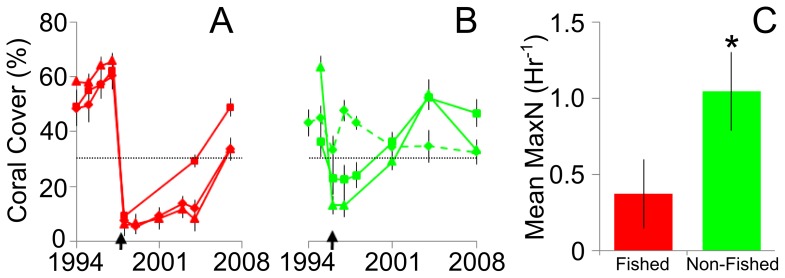
Figure 2. Coral cover and shark density at fished (red) and non-fished (green) reefs.
Coral cover is shown for the (A) Scott Reefs and (B) Rowley Shoals, including reefs with (solid line) and without (dashed line) disturbance events. Arrows denote timing of disturbance and the dashed black line denotes the 30% coral cover threshold. (C) Shark density at fished and non-fished reefs measured as the maximum number of each species seen together at any one time (MaxN) per hour of tape. Values are the means ±95% confidence intervals. *p<0.05 for permuted t-test.

