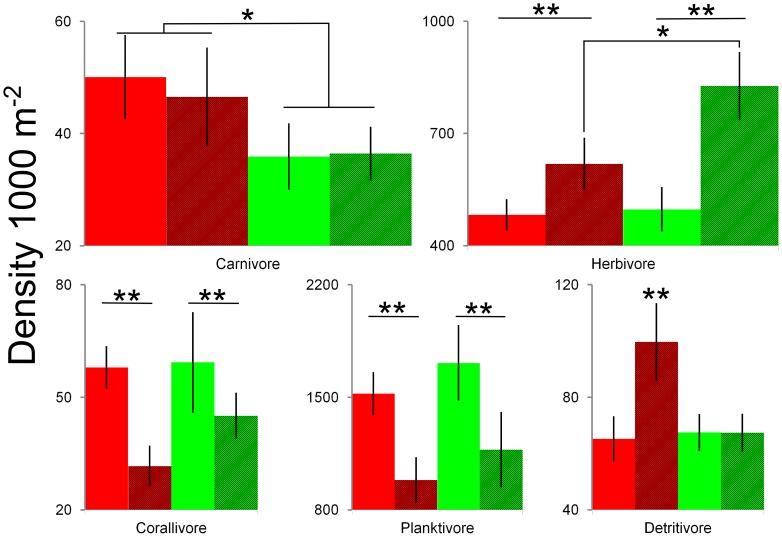
Figure 4. Mean density of trophic groups (±95% confidence intervals) for fished (red) and non-fished (green) reefs.
The density of trophic groups across fished, non-fished, disturbed (stippled bars) and non-disturbed (solid bars) reefs are shown. **p<0.01 and *p<0.05 for permuted ANOVAs and permuted t-tests.

