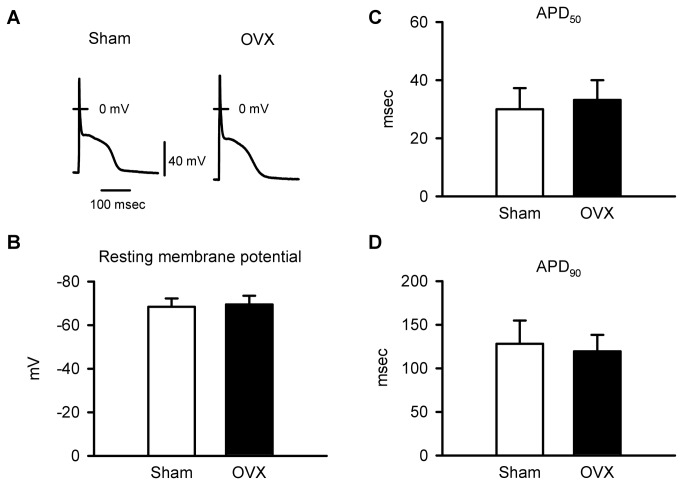
Figure 4. Action potential configurations were similar in myocytes from sham and OVX mice.
A. Representative recordings of action potentials from sham and OVX myocytes. B. Mean values for resting membrane potentials were similar in myocytes from sham and OVX animals. C,D. APD50 and APD90 were not affected by long-term OVX (n=18 sham and 19 OVX myocytes; *p<0.05; t-test).

