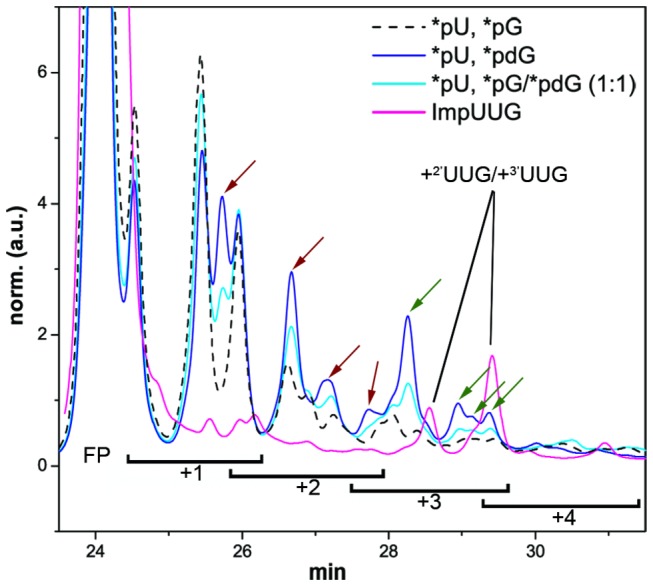
Figure 2. Product accumulation after dG incorporation.

HPLC chromatograms of setup 2 reaction mixtures after 14 days incubation at -18.4°C: black stipples, *pU, *pG; cyan, *pU, *pG/*pdG (1:1); blue, *pU, *pdG. Red: ligation of ImpUUG as internal control for the elution range of FP+3 products (using 2.5 µM FP and 7.5 µM ImpUUG, see Supporting Materials and Methods in File S1 for synthesis of ImpUUG). Arrows indicate accumulated products due to dG insertions; red: non-specific insertion, green: template-directed ones.
