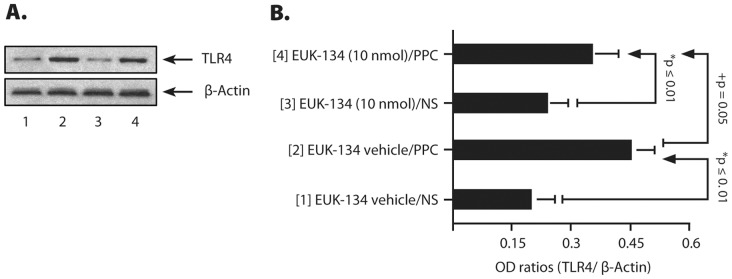
Figure 8. A representative masseter TLR4 expression levels in different treatment groups (A) at d7 after treatments with EUK-134 (10 nmol/mouse), NS and/or PPC (250 pmol/mouse).

The histograms (B) represent the optical density (OD) ratios of TLR4 immunoblot signals normalized to those of β-actin from the same test groups. The numbers in parenthesis in (B) are related to the immuno-blot signals in (A) [n = 5–6 mice/group; *p ≤ 0.01 compared with [EUK-134 (10 nmol)/NS]- and [EUK-134 vehicle/NS]-treated group; + p = 0.05 versus [EUK-134 vehicle/PPC] [1-way ANOVA/Fisher’s PLSD post hoc test].
