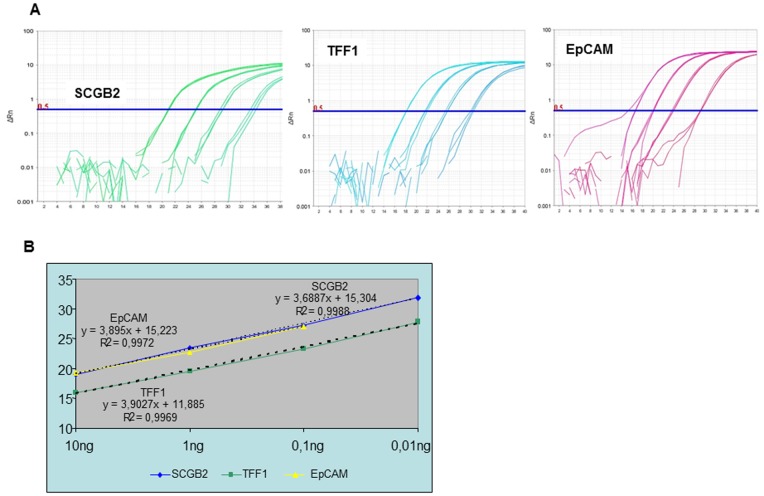
Figure 1. Efficiency, sensitivity and reproducibility of the assays.
A) Amplification curves for a 10-fold dilution series for SCGB2, TFF1 and Muc1 gene. As the template amount decreases, the cycle number at which significant amplification is seen increase. B) Example of a standard curve and illustration of amplification efficiencies between targets. A standard curve shows the quantification cycle (Cq) on the y-axis and the starting quantify of RNA on the x-axis. Slope, y-intercept, and correlation coefficient values provide information about the performance of the reaction.

