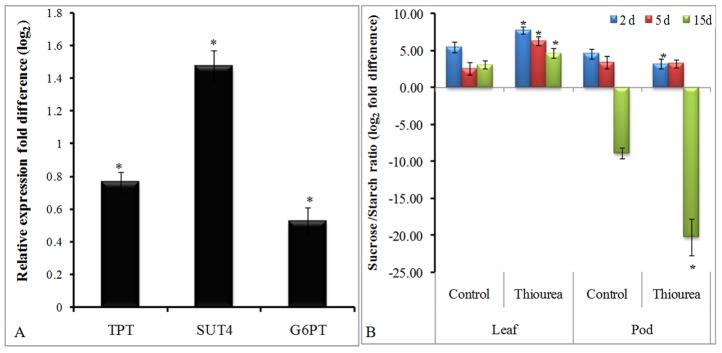
Figure 3. Expression profiling of sugar transporters in source and sucrose/starch ratio in source and sink.

Panel-A represents the expression level of various genes such as TPT, SUT-4 and G6PT in leaves at 2 d after control and TU treatment. The values represent the relative change in expression (log2 fold difference) in TU treated leaves as compared to that of control. The details of the gene-specific primers are mentioned in Table S1. Panel-B represents sucrose/starch ratio in leaf as well as pod of plants at 2, 5, and 15 d after control and TU treatment. The values represent mean ± SD of three independent biological replicates. The significance of mean difference (P<0.05) was evaluated on the basis of student t-test and marked with asterisk (*).
