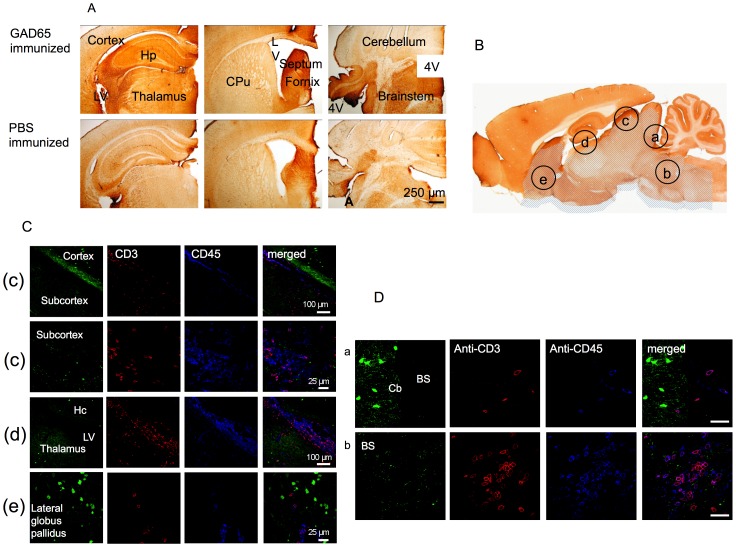
Figure 4. Staining for mouse IgG and T cell infiltrates in mouse brain following immunization with rhGAD65 or PBS.
A. Coronal sections through hippocampus (Hp) and thalamus, striatum (CPu) and fourth ventricle (4V) were stained with anti-mouse IgG antibodies. Note the strong immune reaction (brown deposit) in the hippocampus, thalamus, septum, brainstem, adjacent to the ventricles and the lateral access of the fourth ventricle. Intensity of immunoreactivity appeared greater in GAD65 immunized mice brains compared to PBS immunized mice brains but this was not quantified further. LV = lateral ventricle. B. Sagittal section of a rodent brain showing the five regions investigated for cellular immunopathology. C. Confocal images showing T cells (CD3, red filter) and leucocytes (CD45, blue filter) in the brain regions. Some cells were identified in the subcortex, in the thalamus, the lateral ventricles and the lateral globus pallidus, but there were very scarce infiltrates in the cortex and hippocampus. D. Higher power images through the cerebellum and brainstem of the one GAD-immunized mouse with T cell (CD3, red filter) and leucocyte (CD45, blue filter) infiltrates in the brainstem, which were not found in the cerebellum. Note that the brainstem but not cerebellum was positive for IgG deposits (A). BS = brainstem; Cb = cerebellum. Scale bar = 25 µm.

