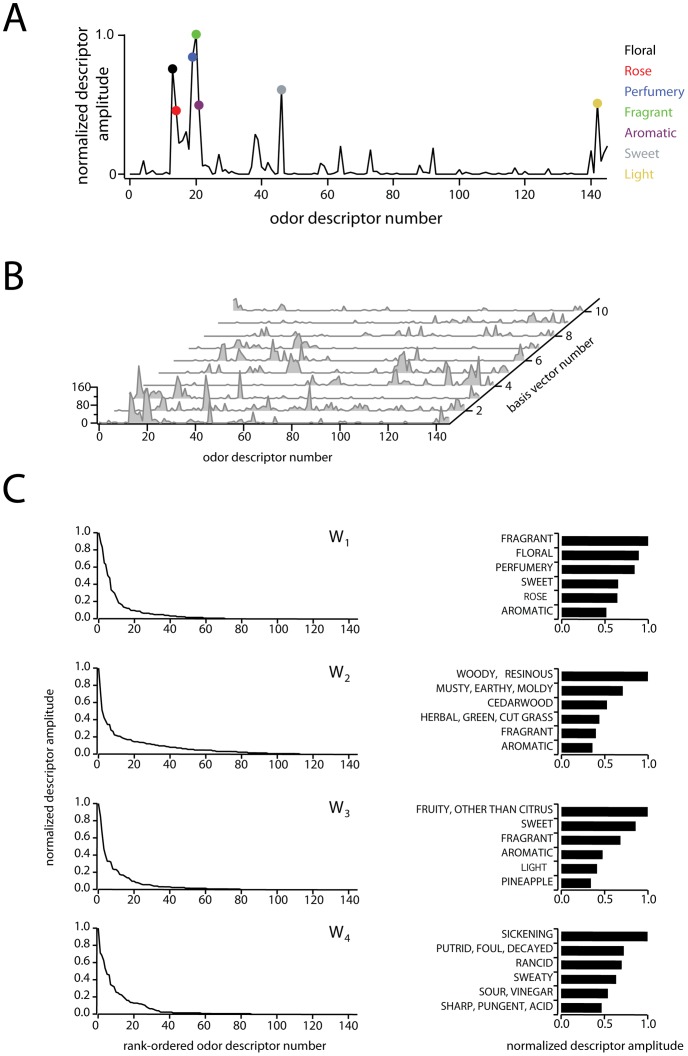
Figure 2. Properties of the perceptual basis set  .
.
Plot of normalized odor descriptor amplitude vs. odor descriptor number for the basis vector  . Each point along the x-axis corresponds to a single odor descriptor, and the amplitude of each descriptor indicates the descriptor's relevance to the shown perceptual basis vector. Colored circles show the
  largest points in the basis vector, and descriptors corresponding to these points are listed to the right.
  Waterfall plot of the 10 basis vectors constituting
  , used in subsequent analyses. Note that each vector contains many values close to or equal to zero.
  Detailed view of the first four basis vectors and their leading values. Left column: peak-normalized, rank ordered basis vectors, illustrating their sparseness and non-negativity. Right column: semantic descriptors characterizing the first four basis vectors. Bars show the first six rank-ordered, peak-normalized components of basis vectors 1 through 4 (subset of data from left column). The semantic label for each component is show to the left.

