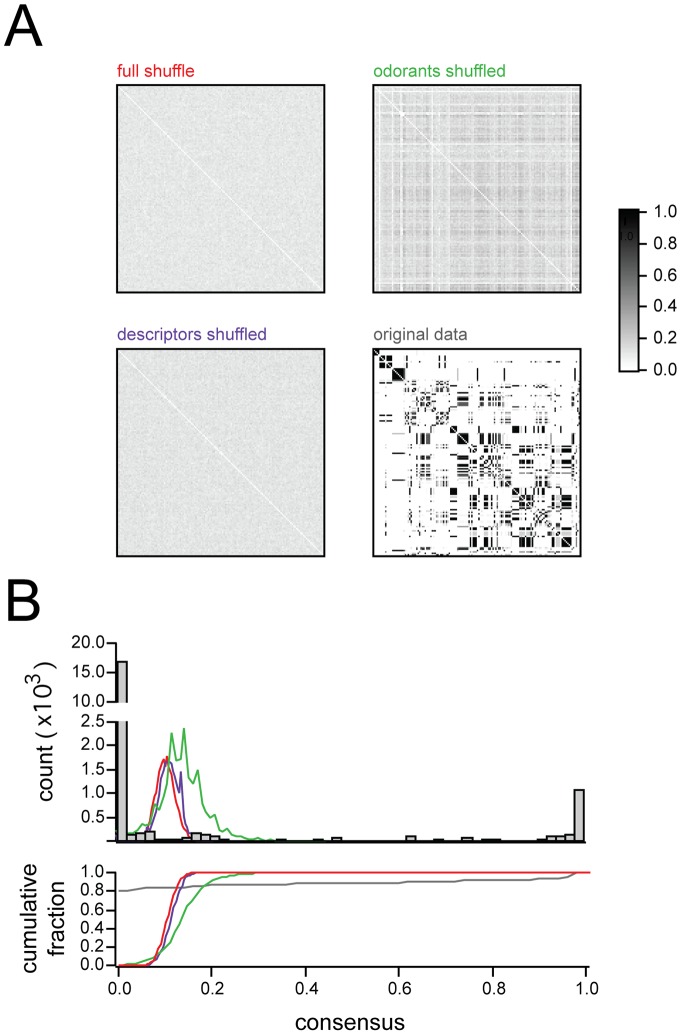
Figure 4. Consensus Matrices for odor-shuffles, descriptor-shuffles, and full-shuffles.
 Consensus matrices (see text) showing reliability of basis sets when NMF is applied to various shuffled versions of the data. Only the original data shows the bimodal distribution of 1s and 0s characteristic of highly reliable clustering. Image ranges and colorscale same for all 4 matrices.
  Top: Histograms of consensus matrix values for the three shuffling conditions, and the original data, confirming that only the original data shows a bimodal distribution of 1s and 0s (line colors correspond to labels in
  ). Bottom: Cumulative histograms, same data as above.

