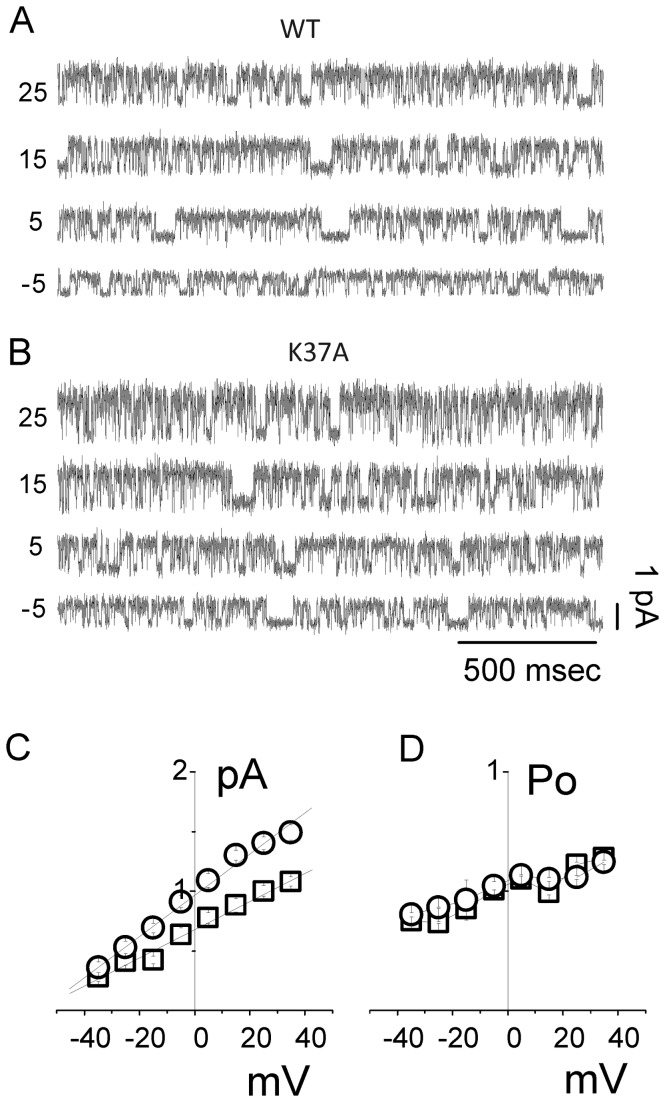
Figure 3. Cell-attached recordings of HEK cells transiently transfected with WT and K37A CLIC1 protein.
Single-channel current traces are shown for WT (A) and K37A (B) CLIC1 transfected cells. The membrane voltage was clamped at different values (indicated on the left of each trace) in 10 mV step increments. Single-channel current/voltage plots are shown in (C) for WT (□) and K37A (○). Average single-channel conductance of 12.1 ± 0.6 pS for WT and 17.4 ± 0.8 pS for K37A with an extrapolated reversal potential of -58 ± 0.7 mV and -56 ± 1.2 mV, respectively, was calculated. The open probability obtained at each membrane potential is shown in (D) for WT (□) and K37A (○).

