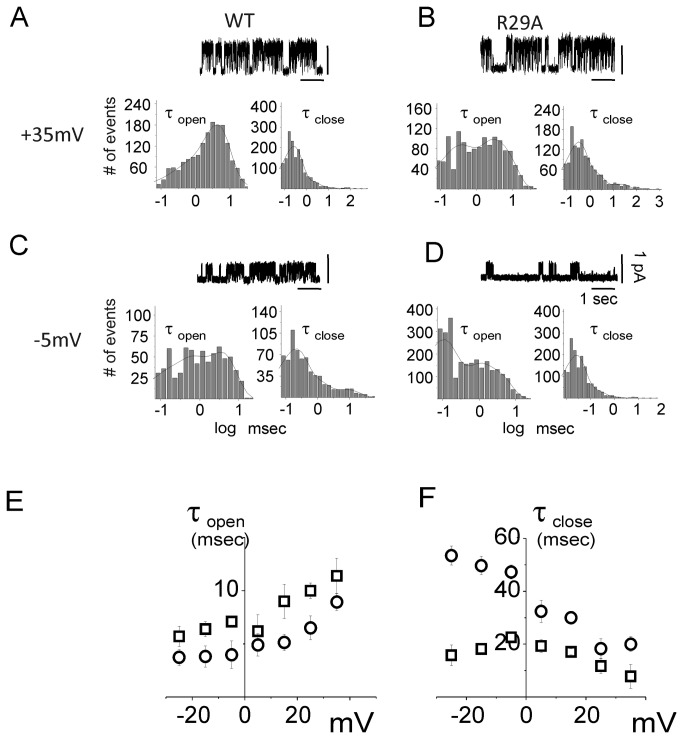
Figure 6. Open (τopen) and close (τclose) time constants of the WT and R29A CLIC1 ion channel.
In panels (A) and (B), membrane potentials were held at +35 mV while panels (C) and (D) concern cell membrane potentials held at -5 mV. The Figure shows open (left) and close (right) time distribution for WT (A, C) and R29A (B, D) CLIC1 transfected HEK cells. Four seconds of single channel recordings appear as inserts in the corresponding panels for each condition. The open and close time distribution histograms were fitted by a double exponential decay function and plotted on a semi-logarithmic scale. Panels (E) and (F) depict open and close time distributions as a function of membrane potential for WT (□) and R29A (○) transfected HEK cells.

