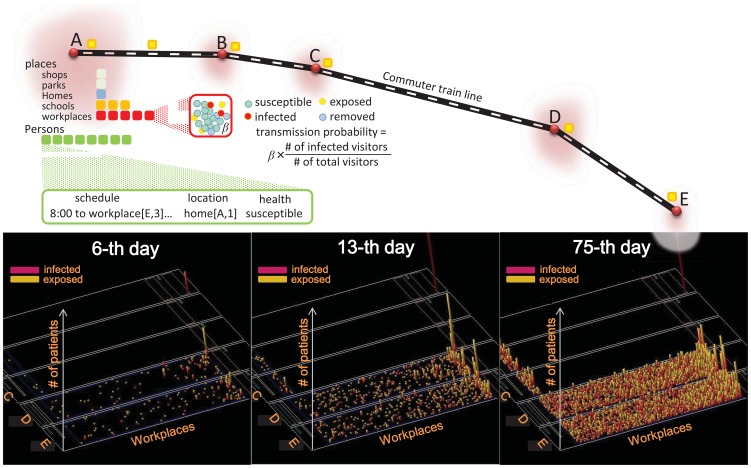
Figure 1. Schematic illustration of the simulator and the model city.
Individual activities are explicitly described and infectious transmissions are stochastically evaluated at local places according to the number density of infectious visitors. The bottom three panels show how influenza spreads over many workplaces in a typical baseline simulation run, where the other places are blank due to a small number of patients there.

