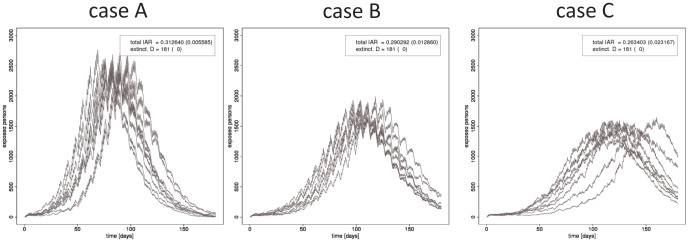
Figure 2. Baseline (without vaccination) simulation run.

Variation of the numbers of residents in states  is shown for cases A, B and C of transmissiblity.

Variation of the numbers of residents in states  is shown for cases A, B and C of transmissiblity.