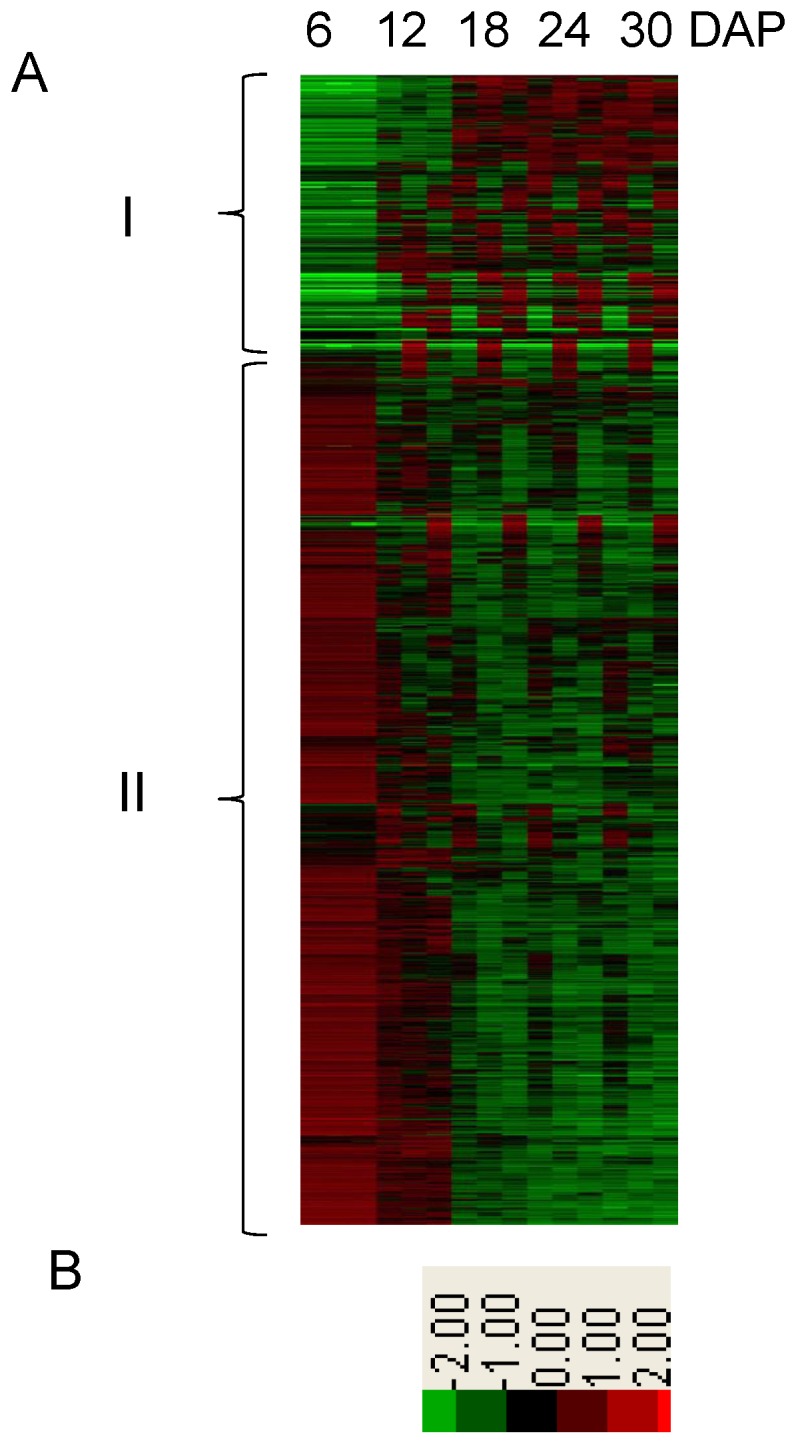
Figure 4. Cluster result of the significantly regulated proteins.

(A) Cluster heatmap of significantly regulated proteins using the protein abundance information. The five columns from left to right are labeled 6, 12, 18, 24 and 30 DAP at the top of the heatmap. The left braces indicate the two groups classified by cluster analysis. (B) Color diagram of the heatmap.
