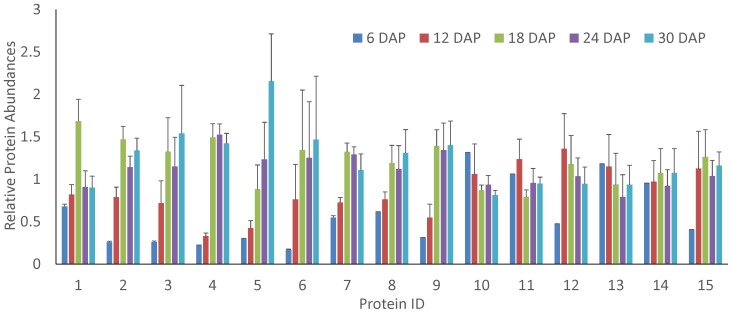
Figure 6. Relative abundance of lipid transfer proteins during embryogenesis.
The error bars indicate the standard derivation. 1 indicates the LTP with Locus ID LOC_Os07g11630.1; 2, LOC_Os03g02050.1; 3, LOC_Os12g02320.1; 4, LOC_Os11g40530.1; 5, LOC_Os08g03690.1; 6, LOC_Os05g40010.1; 7, LOC_Os01g60740.2; 8, LOC_Os11g02400.1; 9, LOC_Os10g36170.1.

