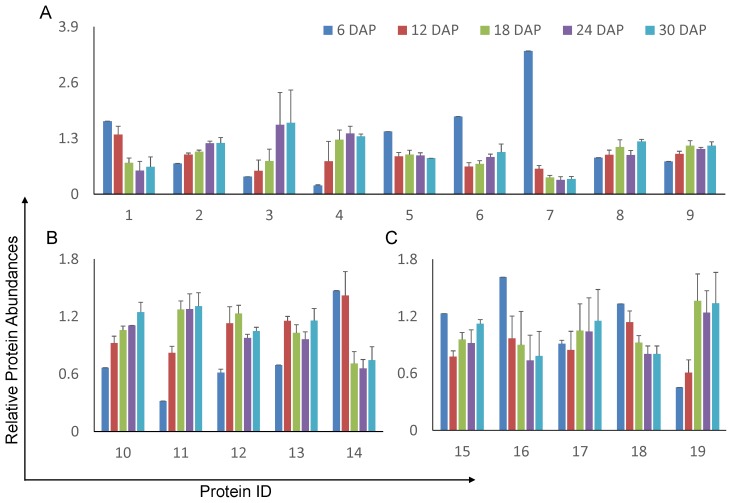
Figure 7. Relative abundance of ROS-related proteins during embryogenesis.
(A) Peroxidases. (B) Peroxiredoxins. (C) Doxins. The error bars indicate the standard derivation. 1 indicates the protein with Locus ID LOC_Os04g56180.1; 2, LOC_Os04g59260.1; 3, LOC_Os04g59150.1; 4, LOC_Os06g35520.1; 5, LOC_Os12g07820.1; 6, LOC_Os08g43560.1; 7, LOC_Os03g17690.1; 8, LOC_Os02g44500.1; 9, LOC_Os04g46960.2; 10, LOC_Os05g25850.1; 11, LOC_Os07g44430.1; 12, LOC_Os01g16152.1; 13, LOC_Os06g42000.1; 14, LOC_Os02g09940.1; 15, LOC_Os07g08840.1; 16, LOC_Os03g58130.1; 17, LOC_Os06g21550.1; 18, LOC_Os10g35720.1; 19, LOC_Os04g42930.1.

