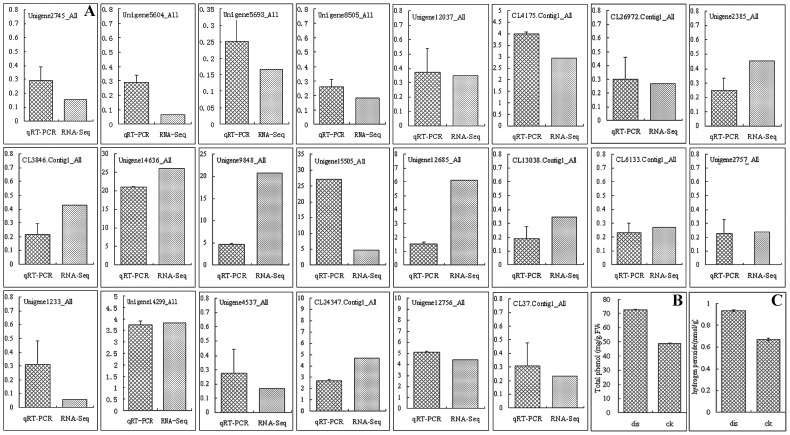
Figure 4. A: Real-time quantitative RT-PCR confirmation of the differentially expressed genes between normal control (CK) and surface brown spots disease (SBS, dis) fruit.
B: The total phenolic content in CK and SBS fruit. C: H2O2 content in CK and SBS fruit. The total phenolic was measured using the Folin-Ciocalteu method. Columns and bars represent the means and standard error (n = 3), respectively.

