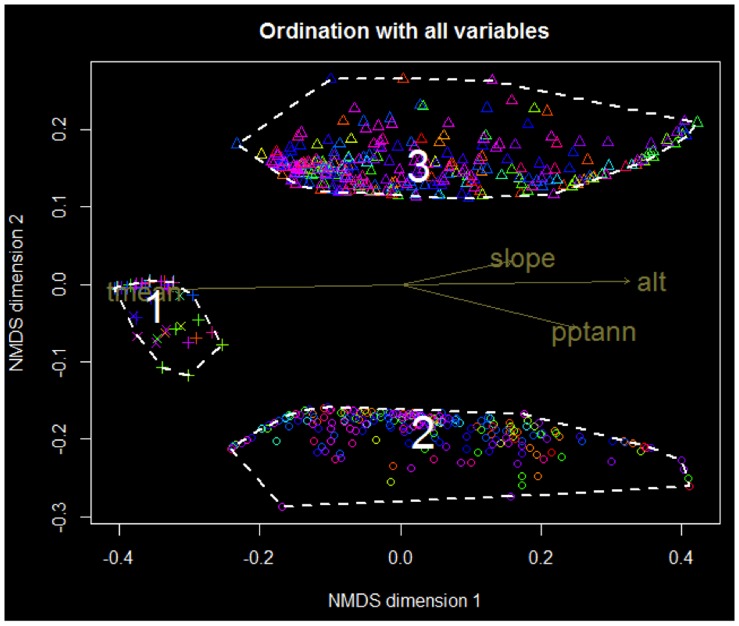
Figure 3. Groups of NES according to environmental variables.
(pptann : total rainfall per year, tmean: mean temperatures, alt: altitude). Each point is a unique NES. Symbols represent the geological substrate of the NES (o: volcano-sedimentary, Δ: ultramafic, +: anthropic formations and riverbanks, x: limestone). Points are coloured according to taxonomic families.

