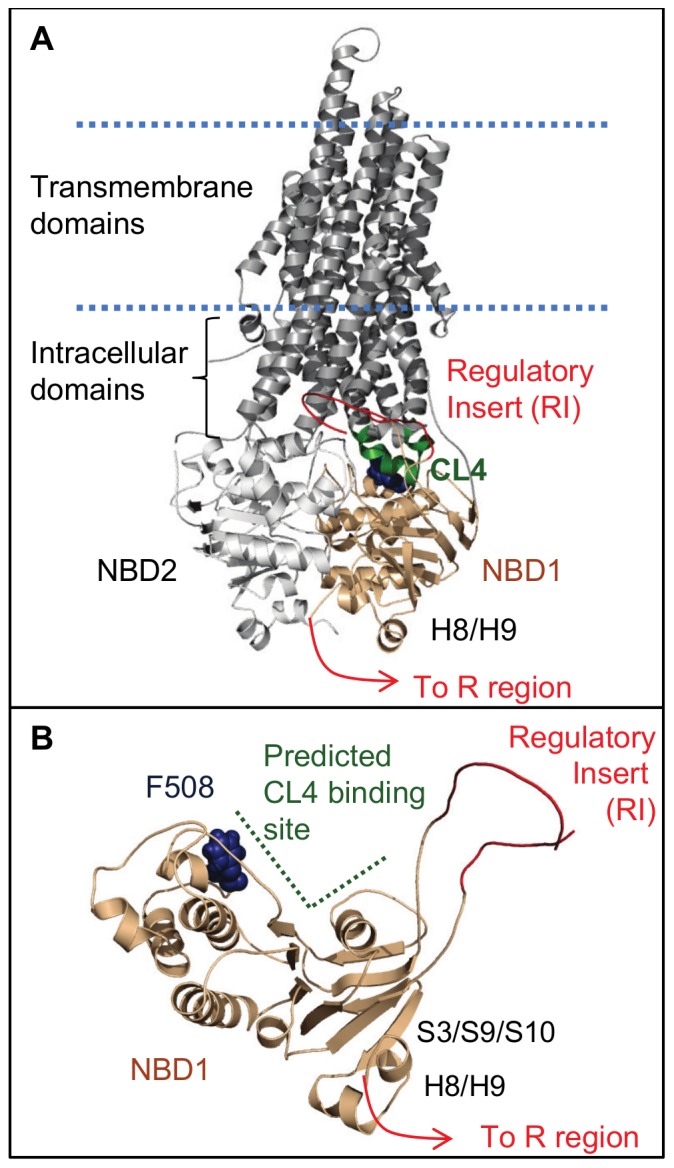
Figure 1. CFTR and its domains.

A. Ribbon diagram of CFTR. NBD1 interacts with NBD2 and intracellular coupling helices, such as CL4. The disordered regulatory insert (RI) of NBD1 and the R region, which follows helices H8/H9 of NBD1, are sites of phosphor-regulation of the channel. B. NBD1 viewed from the NBD1:NBD2 interface. Residue F508 is in the CL4-binding site predicted by homology models [8], [9]. The figures were rendered with PyMOL [81] using a CFTR homology model [9]. The regulatory insert was modeled as a smoothed loop.
