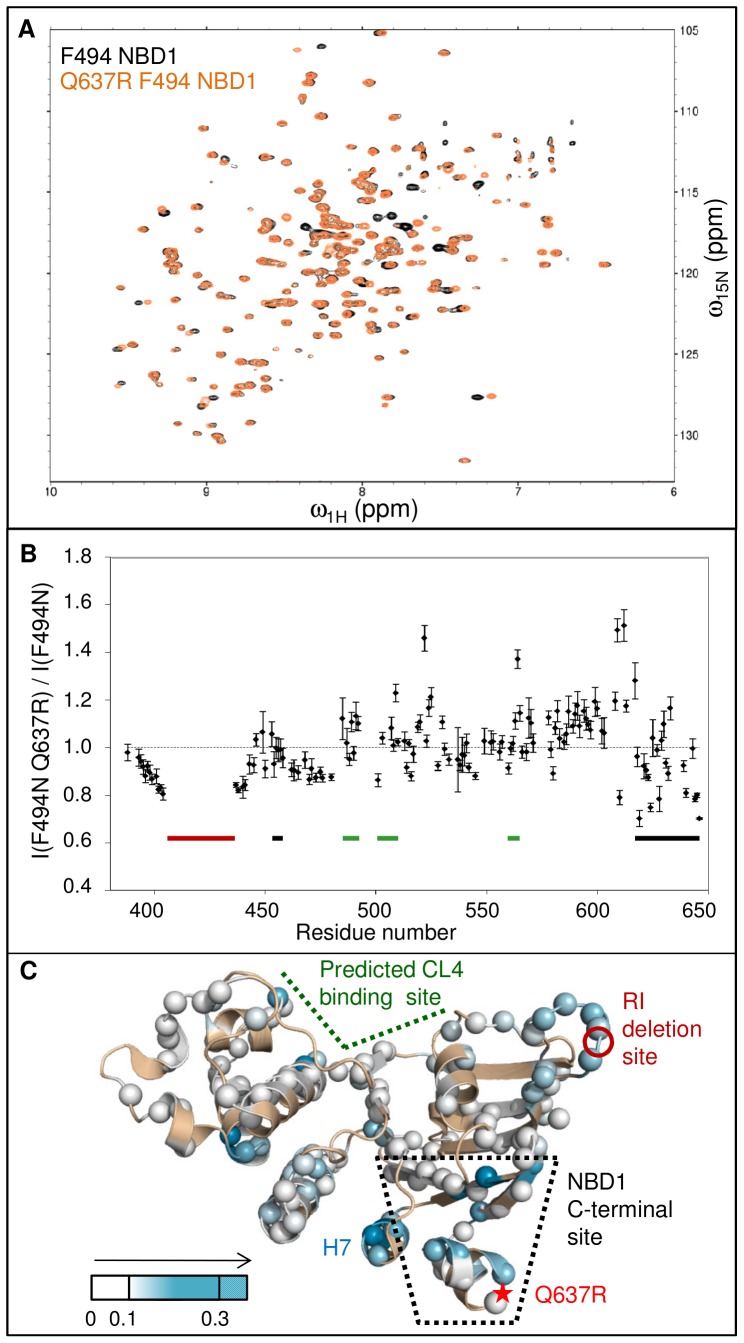
Figure 2. Change in peak intensity due to H8/H9 mutation Q637R.
A. Overlay of F494N (black) and F494N/Q637R (orange) NBD1 HSQC spectra. B. Ratio of peak intensities for NBD1 containing the Q637R mutation to those of NBD1 without this mutation, reflective of changes in dynamics, as a function of residue. The approximate boundaries of the predicted CL4-binding site are indicated with a thick green bar and include β-strand S5, the C-terminal end of helix H2 and residues in the F508 loop (residues 485–492,501–510), and part of H5 (residues 560–565). The NBD1 C-terminal site (residues 453–458, 615–646) contains a β-sheet S3/S9/S10 and the C-terminal helices H8/H9 and is marked with a thick black line. The regulatory insert (RI, residues 405–436) is excluded from the NBD1 construct. A red line marks the deleted residues. Much of the Q loop (residues 492–502) remains unassigned, leading to missing information for these important residues at the NBD hetero-dimer interface. C. Dynamics changes (absolute value of the intensity ratio minus one) due to Q637R mapped onto the structure of NBD1, highlighting long-range effects in the RI-deletion site and CL4-binding site. Q637R effects were probed using F494N NBD1 for improved solubility and spectral quality. Figure rendered with PyMOL [81] using the NBD1 ΔRI ΔRE structure (PDB: 2PZE). View from the NBD1:NBD2 interface. (Unless indicated otherwise, all mapping figures use this structure.) The RI-deletion site is marked in red. Q637R, located between C-terminal helices H8 and H9, is marked with a red star due to lack of electron density in the structure.

