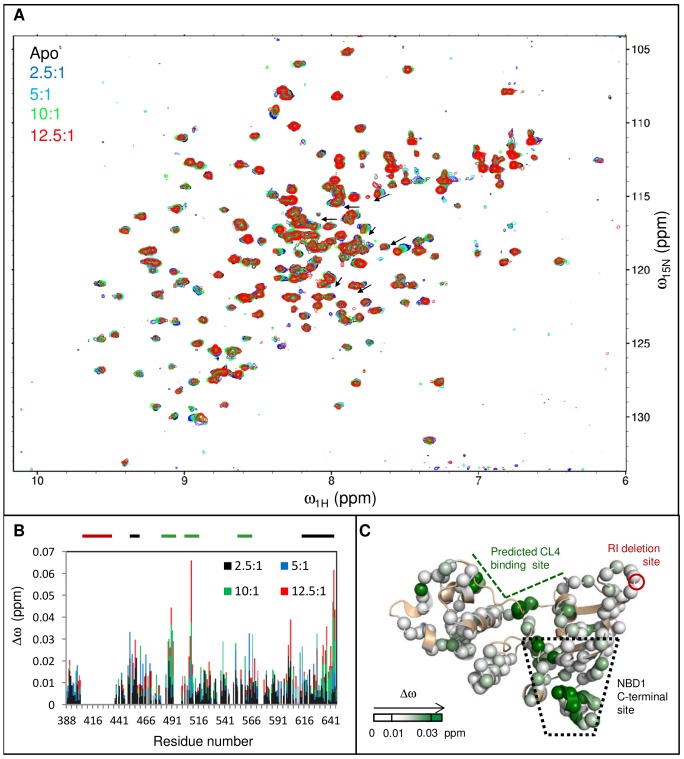
Figure 3. Chemical shift changes due to CL4 binding to WT NBD1.
A. An overlay of the CL4:WT NBD1 titration spectra exhibits the relatively small chemical shift changes due to binding. A selection of well-resolved H9 residues are marked with arrows, indicating the shift toward random coil chemical shift values during titration. B. Δωobs as a function of residue upon CL4 peptide (residues 1057–1075) binding for increasing concentrations of CL4 peptide, shows perturbations near F508 and the C-terminal helices H8 and H9. The CL4-binding site, the RI residues deleted from the construct and the NBD1 C-terminal site are indicated with thick bars above the chart that are colored green, red, and black, respectively. C. Δωobs between spectra of apo and 12.5∶1 CL4 peptide:WT NBD1 are mapped onto the NBD1 structure using a white to green gradient (unassigned or unanalyzed residues in tan). The largest Δωobs values are observed in the CL4-binding site predicted by homology models [8]–[10] and the NBD1 C-terminal site formed by strands S3/S9/S10 and helices H8/H9.

