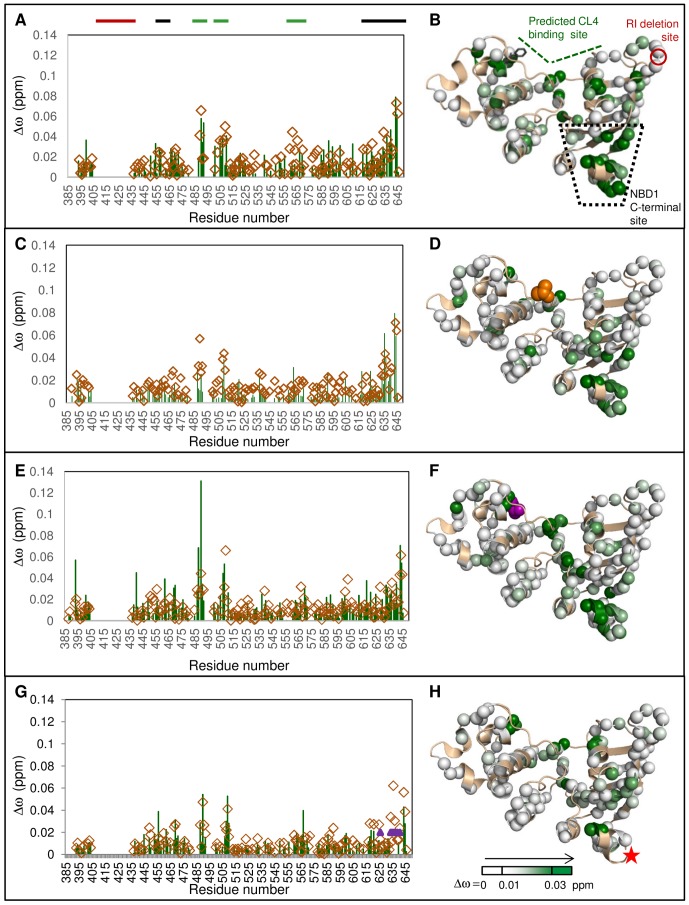
Figure 4. CL4 binding leads to similar chemical shift changes for NBD1 mutants.
A, C, E, G. Δωobs between spectra of apo and CL4 peptide:NBD1 are shown in green for F508del, F494N, V510D, and Q637R NBD1, respectively. The Δωobs values for the buffer-matched CL4:WT NBD1 control spectra for each mutant are shown as open brown diamonds. Purple triangles in chart G indicate residues that could not be assigned for Q637R NBD1. The CL4:NBD1 proportions are 10∶1 for Q637R NBD1 and its CL4:WT NBD1 control, but is 12.5∶1 for the rest of the data. The thick bars above the charts indicate the CL4-binding site (green), the RI residues deleted from the construct (red) and the NBD1 C-terminal site (black). Δωobs values are mapped onto NBD1 structure as in Figure 2: B B. F508del, D. F494N, F. V510D, and H. Q637R. F508del (position of F508 indicated as black sticks), F494N (orange space-filling representation), and V510D (purple space-filling representation) are near the predicted CL4-binding site. Q637R (red star) is between C-terminal helices H8 and H9.

