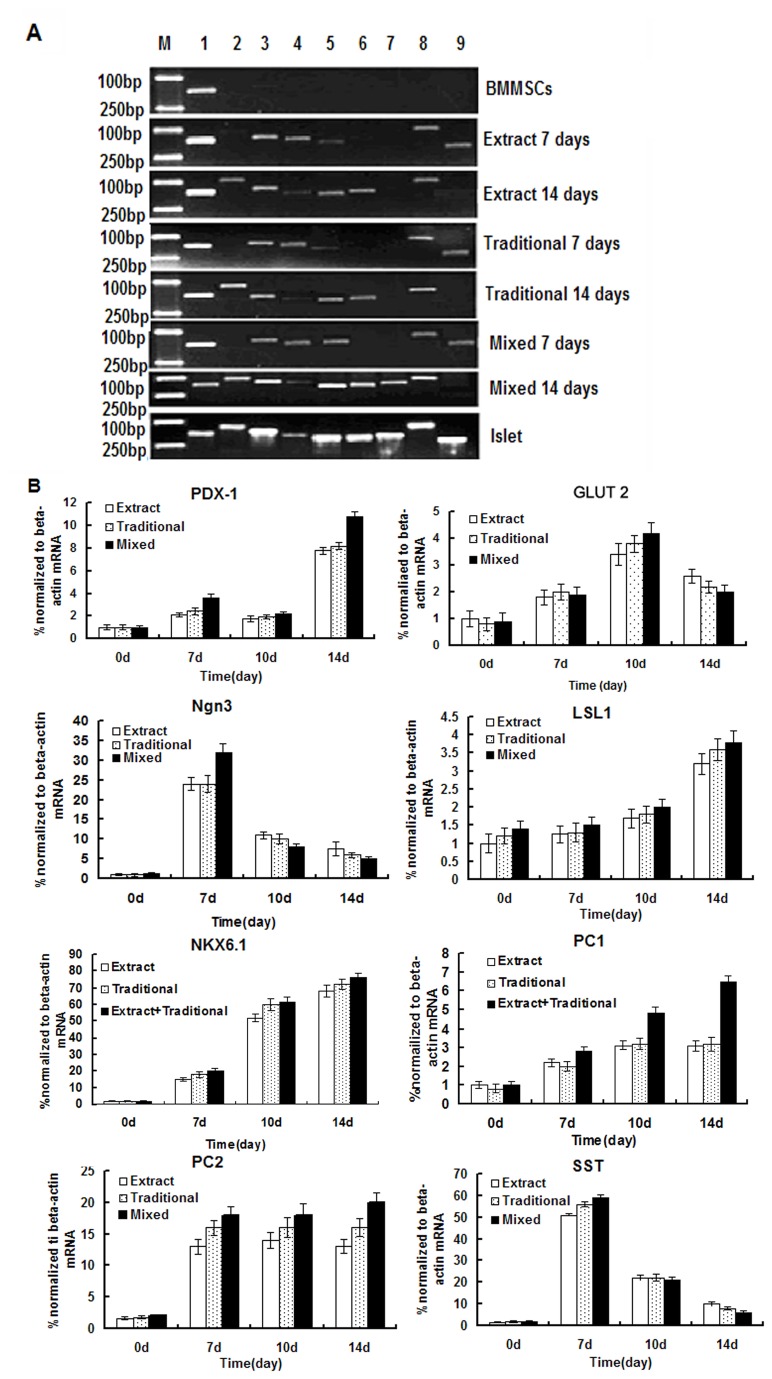
Figure 2. RT-PCR and Quantitative real-time PCR analyses for the expressions of pancreatic β-cell development-related and insulin production related genes.
A. day 7 and 14 differentiated IPCs were analysed RT-PCR (M: marker; l:β-actin, 2:PDX-1, 3:g1ut2, 4:Ngn3, 5:Isl1, 6:Nkx6.1, 7:PC1, 8:PC2, 9:Sst); B. Quantitative real-time PCR analyses for the expressions of PDX-1, g1ut2, Ngn3, Isl1,Nkx6.1,PC1, PC2 and Sst. Results are the means ± SEMs for 3 times.

