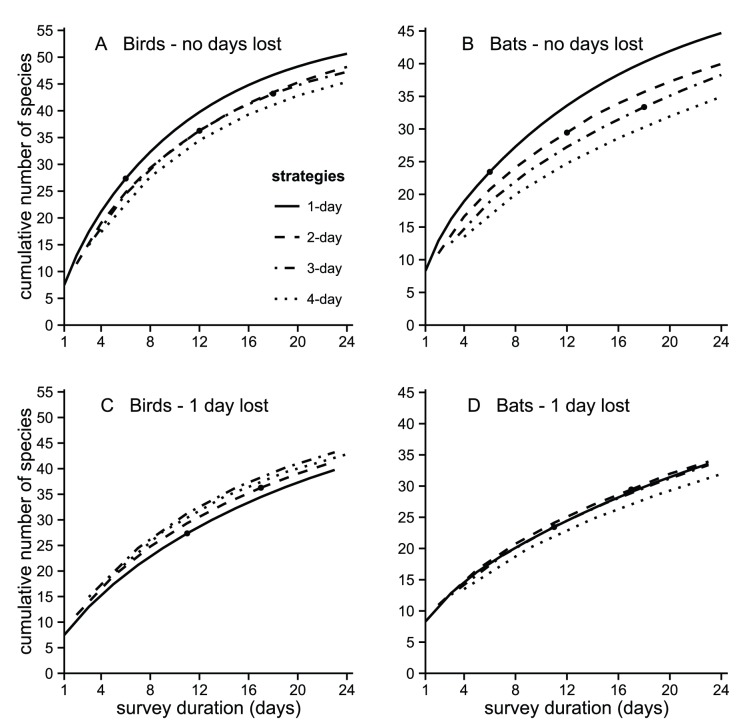
Figure 4. Species rarefaction curves for birds (A,C) and bats (B,D) obtained using four sampling strategies.
Number of species detected in simulated surveys lasting up to 24 days when nets were moved daily or remained at the same location 2, 3 or 4 days. When nets are set up in the same locations on consecutive days, net avoidance causes an increasing decline in the number of species detected in the bird survey (A) and especially in bats (B). However, when moving the nets involves losing one field working day per site net avoidance does not affect the total numbers of species detected in the survey of birds (C) and bats (D). Above the black dots curves are extrapolated.

