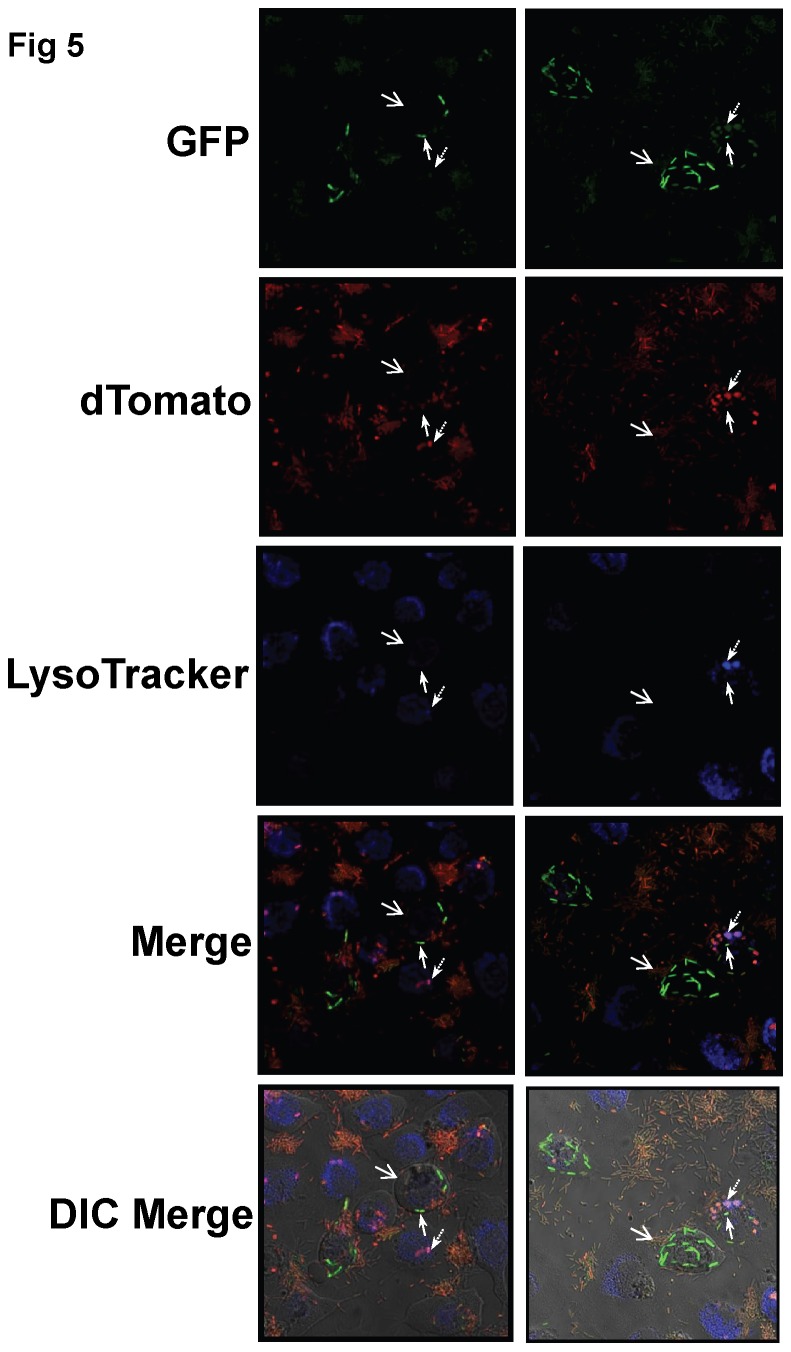
Figure 5. Colocalization of P. aeruginosa with acidified versus non-acidified vacuoles in relation to exoS transcriptional output.
Confocal and Differential Interference Contrast (DIC) microscopy of human corneal epithelial cells at 5 h post-infection with P. aeruginosa PAO1 complemented with a reporter construct pJNE05 encoding the exoS promoter fused to gfp (green), and p67T1 which constitutively expresses dTomato (red). Bacteria were classified as having a high exoS transcriptional output using a threshold value of 1000 units of GFP fluorescent intensity (green) based on expression levels observed under T3SS-inducing conditions (see Results). Prior to imaging, epithelial cells were infused with LysoTracker DND-22 (blue). ExoS-expressing bacteria (high output, green) [solid arrows] were located primarily outside of acidified (blue) intracellular compartments, which often contained bacteria with low exoS output [dashed arrows]. Blebs are indicated with open arrows. Representative images are shown from two independent experiments. Magnification ~ 600 x.

