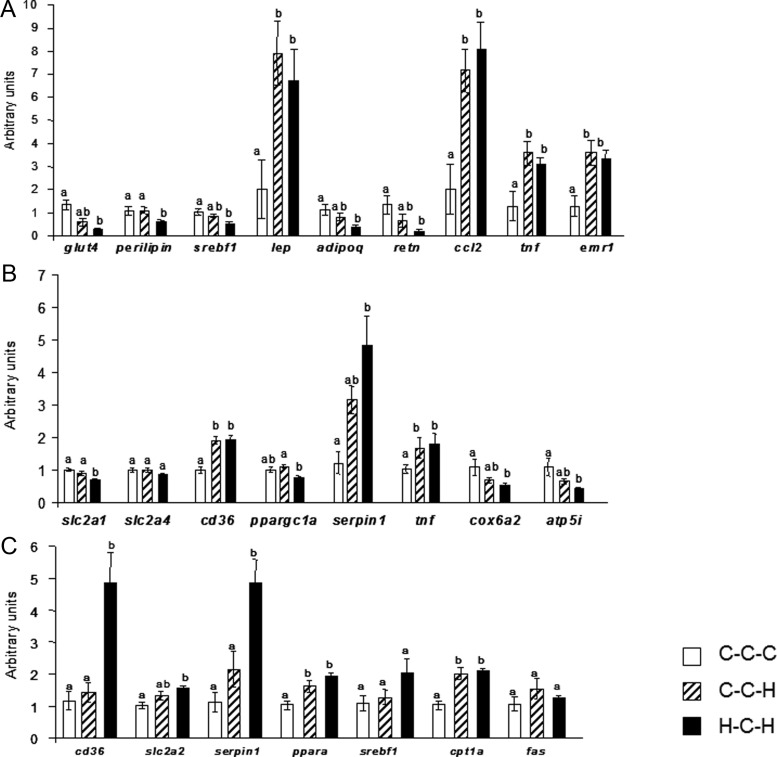
Figure 4.
Gene expression levels in epididymal adipose tissue (A), gastrocnemicus muscle (B), and liver (C). Kruskal-Wallis test with Bonferroni post hoc test was used; groups that do not share the same letter are significantly (P < .05) different from each other; n = 5 per group. White bars, C-C-C; striped bars, C-C-H; black bars, H-C-H.

