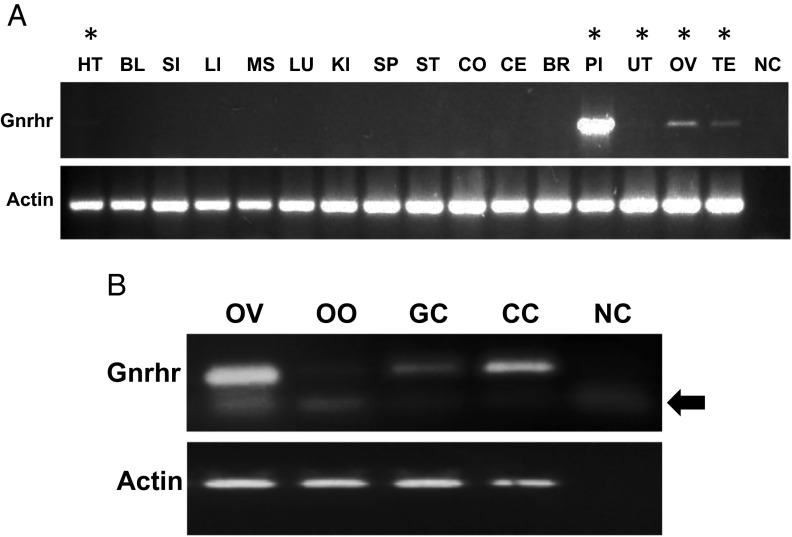
Figure 1.
GnRHR expression in the pituitary and extrapituitary tissues. A, GnRHR expression in the pituitary and selected extrapituitary tissues. Top panel, GnRHR expression was tested by RT-PCR using primers F1–R1 in exons 2 and 3 (see Materials and Methods). Bottom panel, Control RT-PCR for β-actin. The tissues labeled with an asterisk indicate presence of GnRHR expression. BL, bladder; BR, brain; CO, colon; CE, cerebellum; HT, heart; KI, kidney; LI, liver; LU, lung; MS, muscle; NC, negative control; OV, ovary; PI, pituitary; SI, small intestine; SP, spleen; TE, testis; UT, uterus. B, GnRHR mRNA expression within the mouse ovary. Primers used were 2.3F-2.3R in exons 2 and 3 (see Materials and Methods). The top band is the specific band, and the lower band (labeled with a bold arrow) is a nonspecific band also seen in the negative control. CC, cumulus cells; GC, granulosa cells; NC, negative control; OO, oocyte; OV, ovary.

